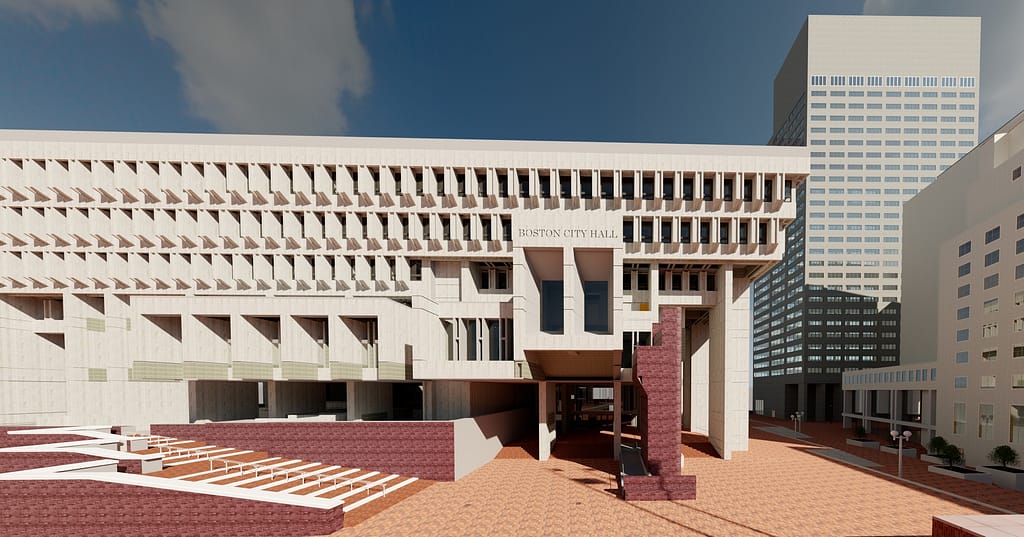
Boston City Hall was built in 1968, to help boost the city’s economy after years of stagnation. The building and surrounding plaza sought to modernize the city’s urban centre, reinvigorating the run-down neighbourhood of Scollay Square.
Despite the public investment project being welcomed by the people of Boston, the buildings ‘brutalist’ style of architecture created debate amongst the locals, with some suggesting you either love or hate the concrete design. In spite of the concerns from the public, the city hall has been home to the mayor of Boston and the city council for over 5 decades, and the ‘brutal’ style of architecture has become part of Boston’s rich history.
To encourage more people to use Boston City Hall and to increase accessibility, it was decided in 2017 that the City Hall would be renovated to serve a more modernized purpose. The infrastructure upgrades include better access to utilities, plants and fountains in the plaza area, with the intention of encouraging more people to visit.
The Horizon was a gamechanger…it’s just amazing in terms of the scanning distance, power of the sensor and the ability to easily capture the entire plaza.
Peter Garran and his team, from Aerial Genomics, were appointed by The City of Boston and Sasaki with the task of scanning both the interior and exterior of the City Hall, in anticipation of the renovation project. Spanning 9 floors and housing multiple individual rooms, as well as a busy plaza area, the task of mapping the building threatened to take several months to complete. Also, the City Hall is an active office that contains confidential rooms and Aerial Genomics did not want to disrupt everyday operations too much. Considering their options, the team decided the fastest and most cost-effective way of mapping the building and its surrounding area would be to use mobile LiDAR scanners.
They chose a ZEB Horizon to scan the exterior and inside the Main Hall. The ZEB Revo RT was used to map the buildings vast interior. These scanners were chosen due to their speed, accuracy and mobility. By simply walking around the building, Peter and his team captured the large layout, saving them time.
As they were scanning during the pandemic, it was key for Peter and his team to spend as little time as possible in the building and compared to other scanning methods, GeoSLAM’s scanners were able to deliver on that goal. With the ZEB Horizon, Aerial Genomics captured both the exterior and interior of the Main Hall in just 4 scans, and in less than 2 hours. This scanner was specifically chosen to scan the Main Hall due to its 100m range being able to capture the high walls. To help combat getting in the way of the City Halls’ day-to-day business, the team were given limited amounts of time in the evening to scan a multitude of rooms inside the Hall. Using the ZEB Revo RT, the team could scan the almost 1 million square feet interior, in just 4 nights, consisting of 5 hours each night.
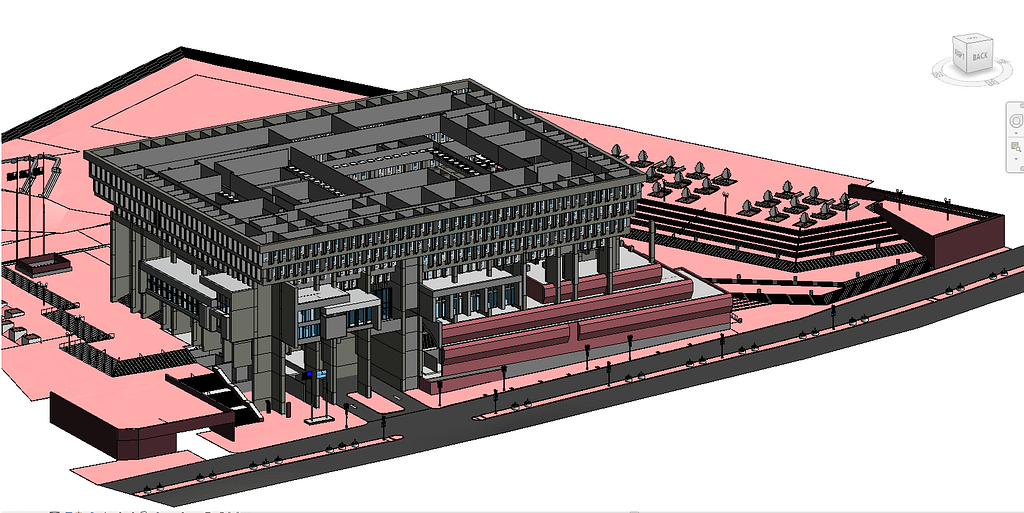
The scans were processed using GeoSLAM Hub and merged to create one point cloud, by Aerial Genomics. The manoeuvrability, ease of use and accuracy that the ZEB scanners provided meant the data collected was ready within a week, to be created as a BIM model to send to the architects. The simple, easy to use solution meant the architects could start thinking about the redevelopment and renovation, without the need to visit the hall during a pandemic. The final BIM model, created in Autodesk Revit, is still referred to today.
If you’d like to learn more about how GeoSLAM solutions can help you, submit the form below.
Mapping a decommissioned power station
Location
Cape Town, South Africa
Scan time
8 Hours Total
Size
Approx. 117,000 m2
Scanned
Power Station
Industry
Surveying
ZEB Family | Safely surveying a hazardous power station
All over the globe, countries are looking to nuclear and hydro renewables, not only to provide their electricity needs but to meet climate goals. This is resulting in the shutting down of coal-fossil power plants that no longer have a role to play in a fast-changing world.
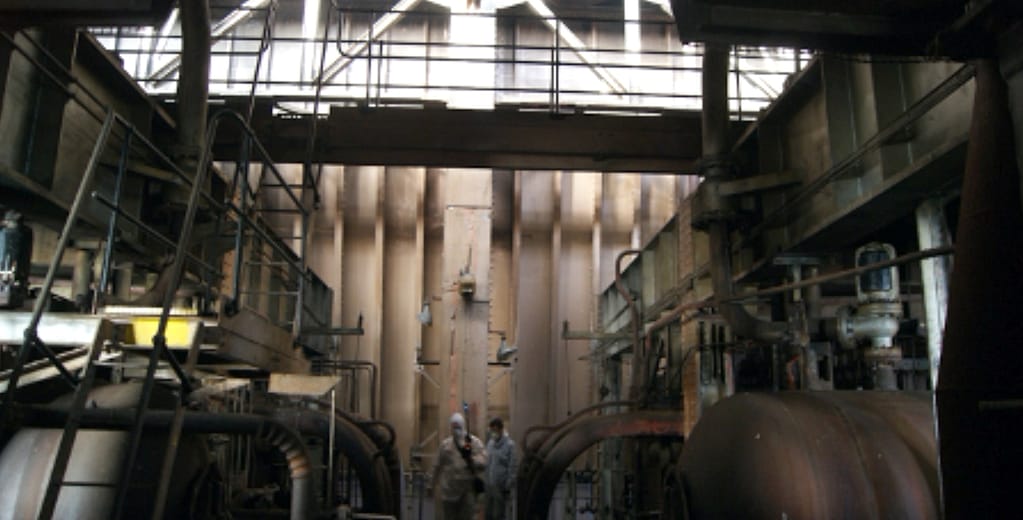
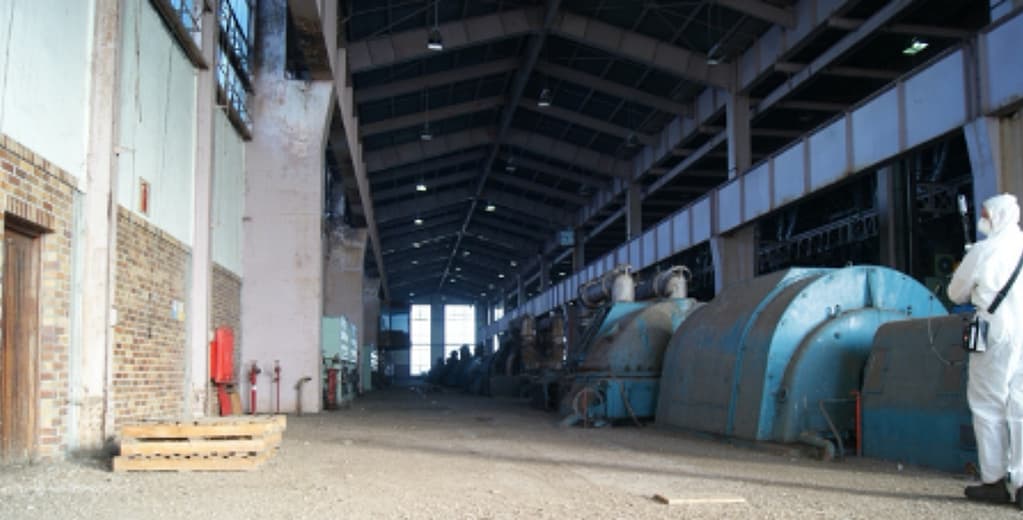
Opened in 1962, the Athlone Power Station was the last coal-fired power station operating in Cape Town, South Africa when it stopped generating power in 2003. The iconic cooling towers, which were known by locals as “The two ladies of Athlone” and had long been a feature of the Cape Town landscape, were demolished several years later.
The efficient user-friendly GeoSLAM equipment enabled the team to safely and comprehensively survey this hazardous and complex plant.
Proper planning was essential as demolition can be potentially hazardous for the safety of personnel due to the plant’s age-structure, and onsite teams often having to operate across split levels, in total darkness. The removal of contaminated waste can be equally challenging. Cost is also a major factor and companies responsible for shutting down plant are continuously looking at ways to be cost effective while providing a reliable, fast and efficient service.
Aurecon, a global engineering, design and advisory company, won the tender from the City of Cape Town to project manage the site for the final stage of decommission. This involved surveying the plant whilst stripping, clearing and removing unused material, redundant equipment and certain historical structures. Their task also included securing all remaining structures, leaving the site in a secure state and registering servitudes for remaining bulk services. Aurecon found Athlone to be a challenging project due to accessibility issues and lack of light. Also, because of the Power Station’s historical importance, salvaging certain unique equipment had to be considered. The team needed a simple and effective solution that could accurately map the site quickly while keeping them safe in a tough environment.
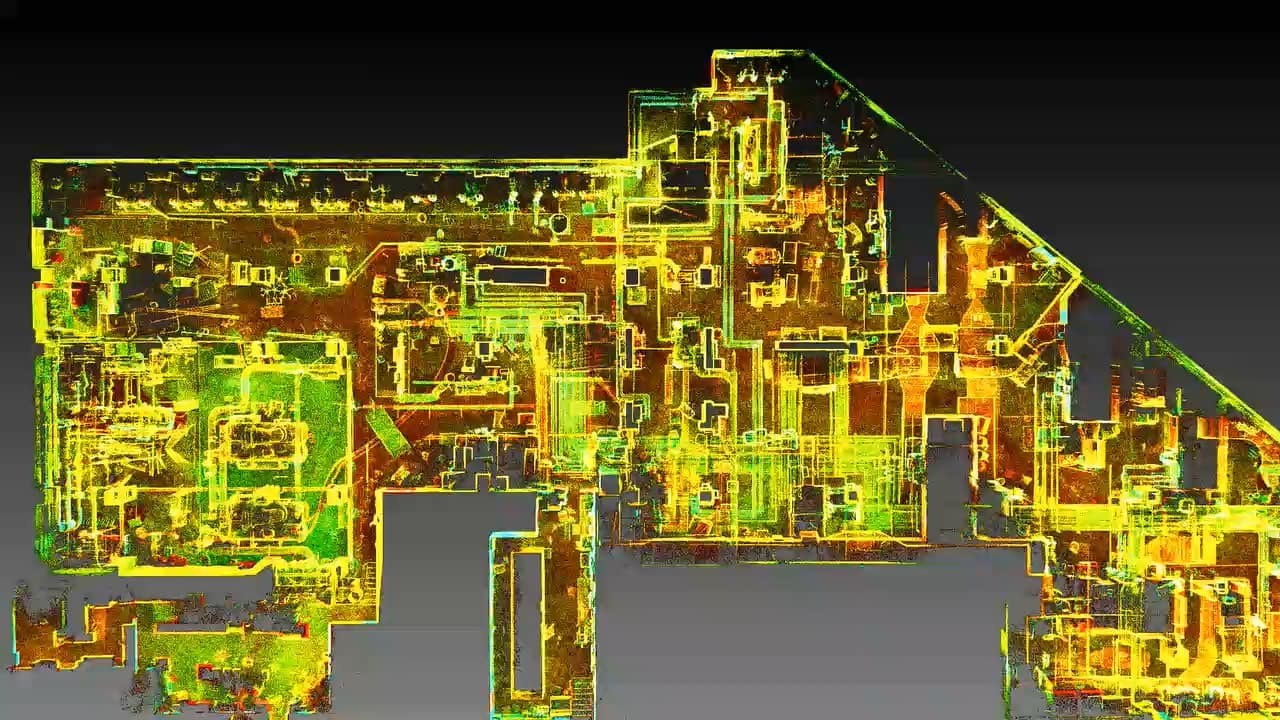
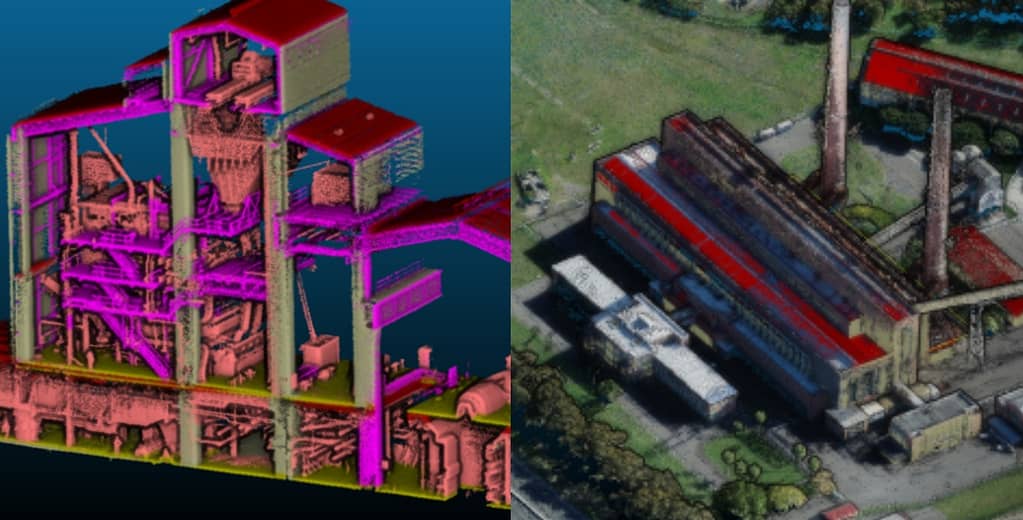
Aurecon chose to work with mobile LiDAR scanners so that the historians, structural engineers and environmentalists could have the data they needed, without having to enter the potentially dangerous site. For the Athlone project, GeoSLAM’s ZEB Revo RT scanner and ZEB Pano camera were used, as well as theZEB Horizon and ZEB Cam. The building’s interior and exterior were scanned with the ZEB scanners The two data sets were merged to provide a full 3D point cloud of the entire building.
Using the Pano, the team generated photos that were incorporated inside the point cloud, so that the offsite survey team could have greater visualisation of the site to feedback commentary. The efficiency of the scanners and speed of capture meant that unlike other scanning methods, the team could repeatedly capture the site. This meant that decisions and assessments could be taken frequently, without the need for lots of people to visit the dangerous site.
In total, the whole facility was scanned in three days with data sets processed overnight, a total of eight hours. The combined datasets were available within a week, which enabled Aurecon’s modellers to commence work on the classification of components in the power station.
The final 3D point cloud representation of the interior of the power station enabled the engineering team to assess and quantify the amount of salvage and scrapped material to be removed from the site, and to plan the logistics of the removal in context with the physical shape and size of the existing building.
The accurate 3D model equipped the stakeholders with information that allowed them to safely and precisely analyse for activities such as material quantification, condition assessment and the preparation of decommissioning method statements.
If you’d like to learn more about how GeoSLAM solutions can help you, submit the form below.
3D Scanning Construction and Demolition Waste
Location
Egypt
Scan time
17 minutesper scan
Size
82,823 m2
Scanned
Construction and demolition waste
Industry
Construction
ZEB Revo RT | Housing and Building National Research Centre
The government of Egypt (GoE) are leading several initiatives to reuse and recycle the ever-increasing quantities of construction and demolition Waste (CDW) around the country. These initiatives include a national strategy and action plan to effectively manage around 40 million tons of CDW generated annually. They target to recycle 50% of CDW materials by 2030. One of the major challenges facing Municipalities in Egypt is calculating the amount of CDW accumulated, due to illegal dumping of waste being common place in cities.
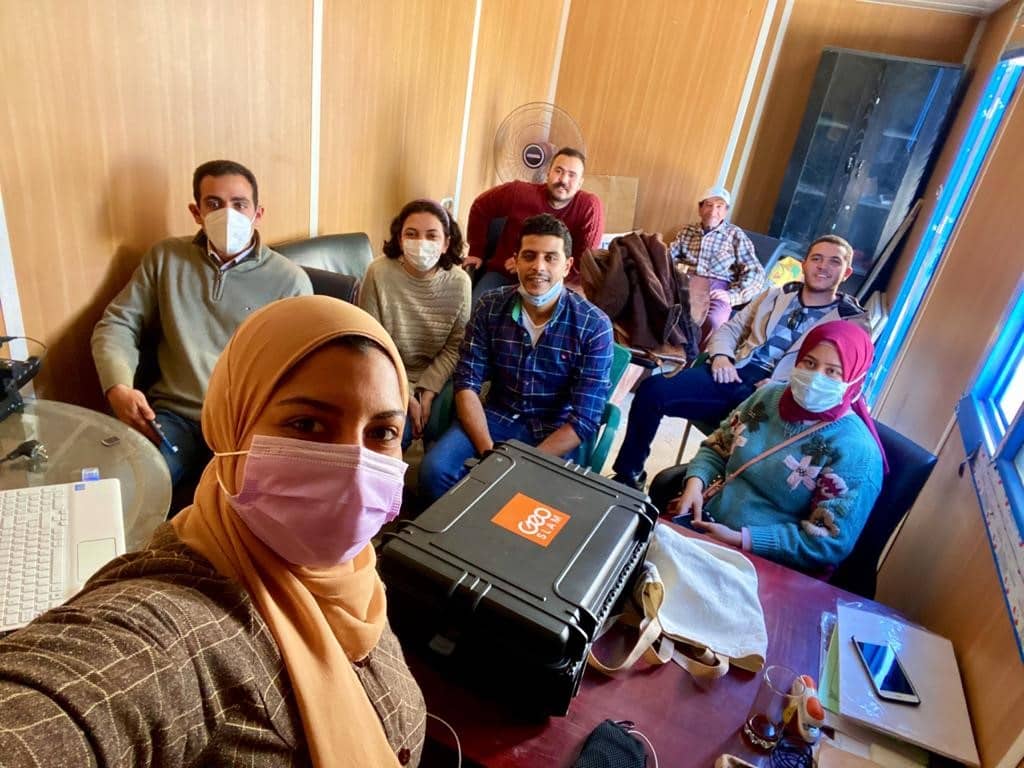
Commissioned by the Ministry of Environment and the GIZ institution, HBRC (Housing and Building National Research Centre) have been tasked with finding effective methods for quantifying and characterising the amount of CDW in four Egyptian Governorates (Gharbia, Kafr-El-Sheikh, Assuit and Qena).
This project paves the way to developing an optimal construction and demolition waste management strategy in Egypt. The research team used GeoSLAM’s ZEB Revo RT SLAM laser scanner to map the construction waste piles. The scan data is a sound method for quantifying waste volumes over a period of time, due to the ease of capture and accurate data.
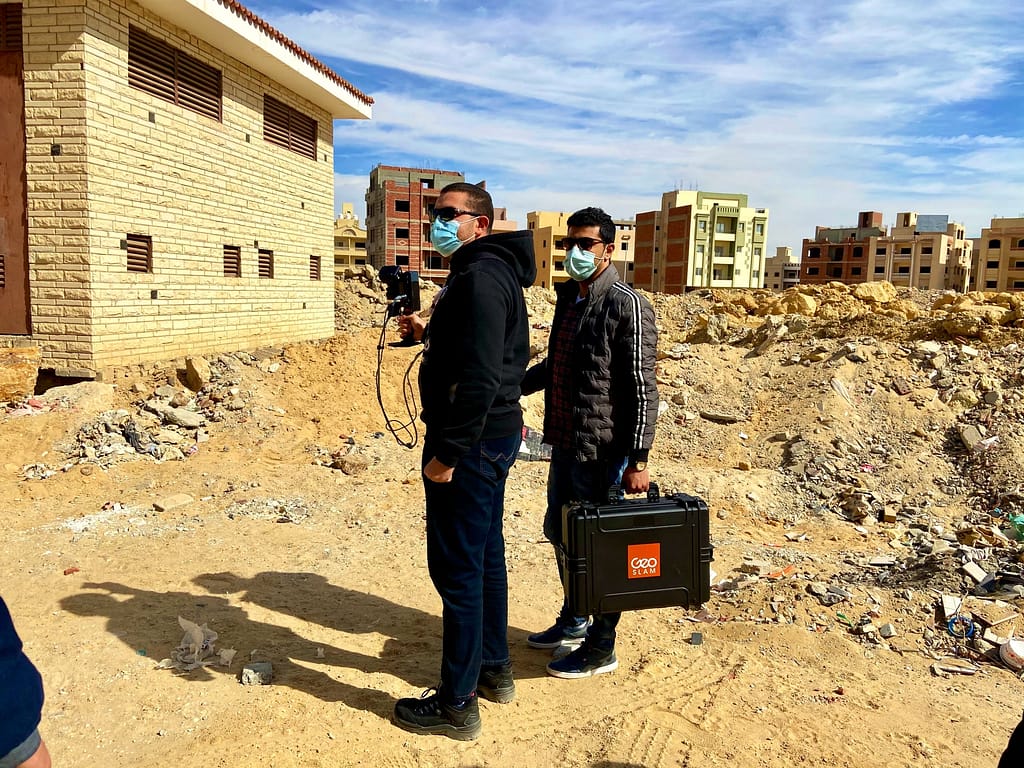
The traditional surveying of CDW accumulations was not practical as CDW locations are difficult to walk through and experience rapid changes to the waste quantities.
The ZEB Revo RT is ideal for rapid data capture in real time, making it the perfect tool for this job. By walking through the construction and demolition waste sites, the team are mapping as they go, shortening the amount of time spent in a hazardous environment, reducing health and safety risks.
The simplicity of the solution means that anybody can capture the data, with minimal training, making the scans repeatable as often as needed. Covering an area of 84,823 m2, the research team conducted 12 scans, dividing the route into zones and each scan lasted an average of 17 minutes.
Once the scanning was complete, they opened the data in GeoSLAM Hub where the point cloud can be viewed and prepared for GeoSLAM Volumes. Using GeoSLAM Volumes, the researchers could accurately calculate the quantity of construction and demolition waste. The findings were reported back in a presentation during the third International conference on Smart Cities.
This way of calculating volumes is fast, efficient, cost effective, safer than other methods and repeatable, making the SLAM scanner the right tool for the job. The research effort opens the door into the utilisation of 3D modelling of construction waste management sites.
The application of laser technology would enable the quick and accurate estimation and modeling of waste quantities.
If you’d like to learn more about how GeoSLAM solutions can help you, submit the form below.
Scanning in America’s oldest show cave
Location
Virginia
Scan time
12 minutes
Size
500 meters
Scanned
Grand Caverns
Industry
Education
Grand Caverns |History, geotourism & science
Discovered in 1804 by Bernard Weyer in the heart of Virginia, Grand Caverns (formerly Weyer’s Cave) is the oldest show cave in the USA. During the US civil war, the cave was used by both Confederate and Union soldiers as part of the Valley campaign, during which time over 230 soldiers signed their names on to the cave walls. More recently, the cave has become a huge tourist attraction, due to its beauty, location and being surrounded by scenic trails for hiking, running, and biking, but it has also captured the attention of the scientific community because of recent discoveries of new passages and the rock formation changes over time.
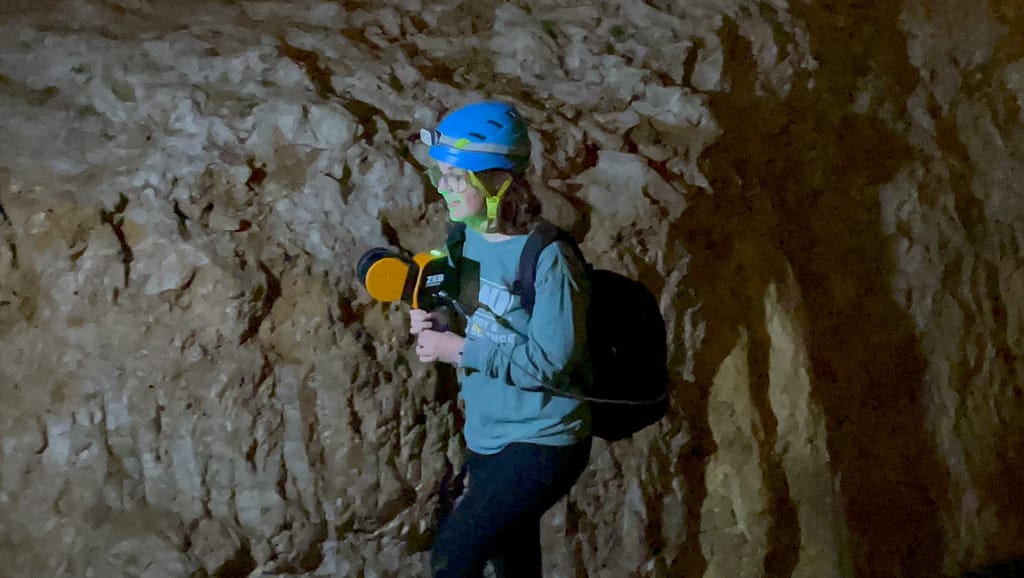
The town of Grottoes (where the show cave is located) partnered with Angel A. Garcia Jr. and his students from James Madison University to create a 3D map of the cave. The 3D point cloud is being used to measure Speleothems, monitor the human impact on the cave, create 3D printed models and to celebrate the show cave’s extensive history, shining a light on its geoheritage. In addition, it is a fantastic opportunity for the undergraduate students of JMU to get hands on experience with the handheld LiDAR scanner and the data it outputs.
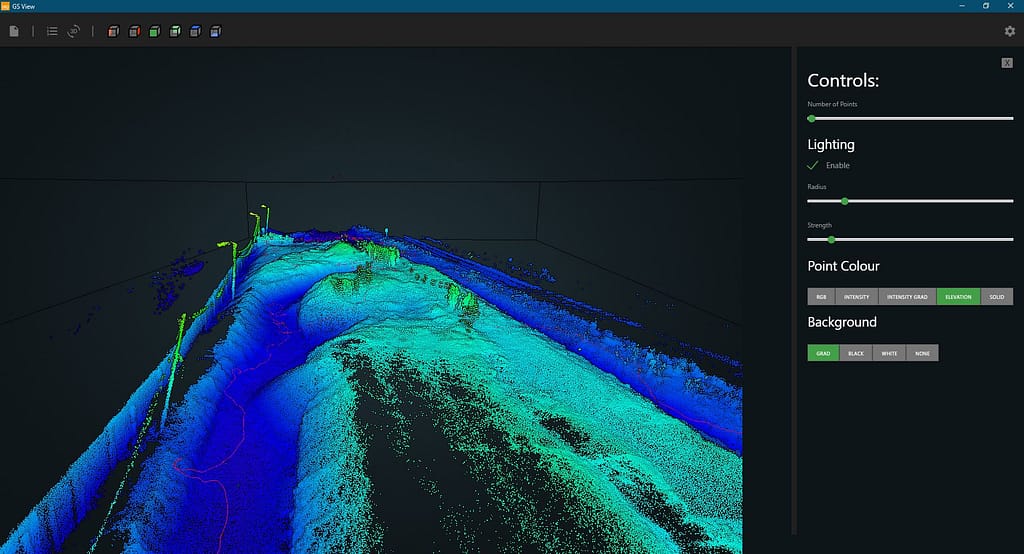
Angel A. Garcia Jr. chose GeoSLAM’s ZEB Horizon scanner to take on the task of mapping both the parts of the cave open to the public and the recently discovered, vast passages. He and his students capitalise on the speed of capture and accuracy of the scanner to review and analyse data in a quick and efficient manner.
With the LiDAR we’ll be able to get into corners and see what hasn’t been looked at for a long time.
Mobile Mapping with the ZEB Horizon
Having originally purchased the ZEB Horizon back in February 2021 to collaborate and share data with partners scanning caves using ZEB devices in Puerto Rico, Professor Garcia began to see the potential and opportunities the scanner offered. Fast, accurate and handheld data capture opens a way to map an area without the need to GPS or complicated setups. In addition, the scanners ease of use means that undergraduate students can be involved in the project with limited to no training.
Since beginning to use the ZEB Horizon, interest in Professor Garcia’s work with the SLAM scanner has escalated, and he has subsequently been invited to other universities to run workshops. In April 2021, he was approached by Grand Caverns to map the historic show cave.
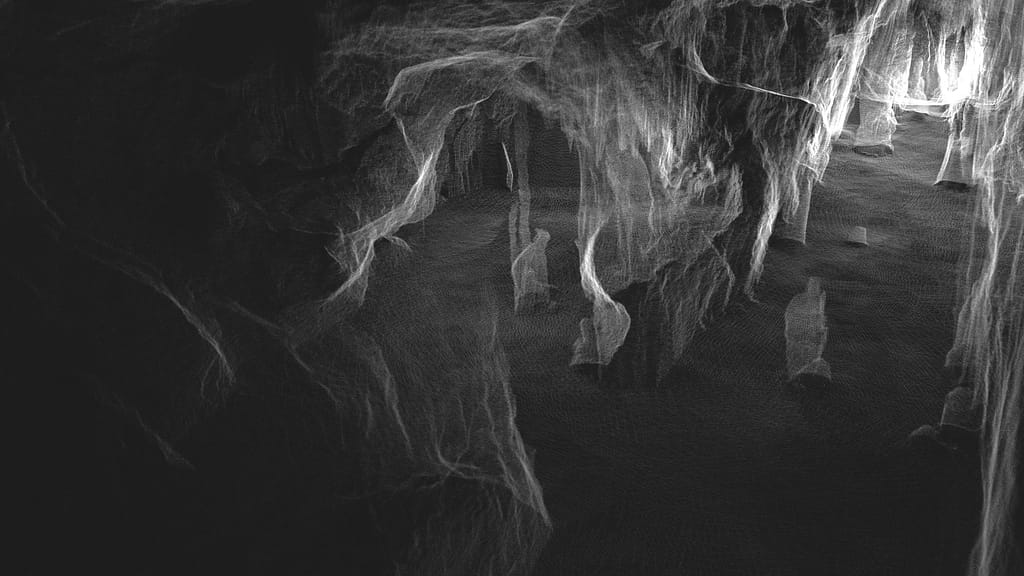
The public area of the cave is approximately 500 meters in length, 30 meters high and has stairways in places, so it is quite a large area to capture. Professor Garcia and his students were able to capture the entire public area in approximately 12-15 minutes, by simply walking and scanning. He pointed out that a terrestrial laser scanner would be able to capture the public part of the cave, but it would take days, not minutes, and due to the uneven surfaces of the non-public area of the cave, it would be impossible to get a tripod-based system down there. Alternatively, you could measure a cave using a distometer, but this could take months, if not years to complete.
The ZEB Horizon was able to give them a quick accurate scan in 12 minutes, so the students could get to work reviewing the data for their various projects.
It’s going be able to detect the stalagmites, the stalactites and it’s even going to be able to detect the cave shield because it’s that precise.
The data is being processed using GeoSLAM Hub, and Draw is being utilised by the team to accurately measure the speleothems over time. The students can see the orientation, thickness and gather measurements using the LiDAR information alone. They are also hoping to use Draw to understand accurate dimensions of the cave. Furthermore, the 3D point cloud is being used as a base to 3D print the cave within a rectangular block, for further research purposes.
The team continued to scan the cave over the summer, and Professor Garcia is working with the caving/spelunking community of experts to begin capturing the more problematic and recently discovered new passages of the cave. These areas have not designed for the public at the moment, so there are uneven surfaces and narrow corridors, but due to the ZEB Horizons mobility, capturing previously unseen parts of cave will be quick and safe.
Professor Garcia concludes by saying that the 3D model will provide an opportunity for those who can’t physically enter the caverns, to learn what they are all about.
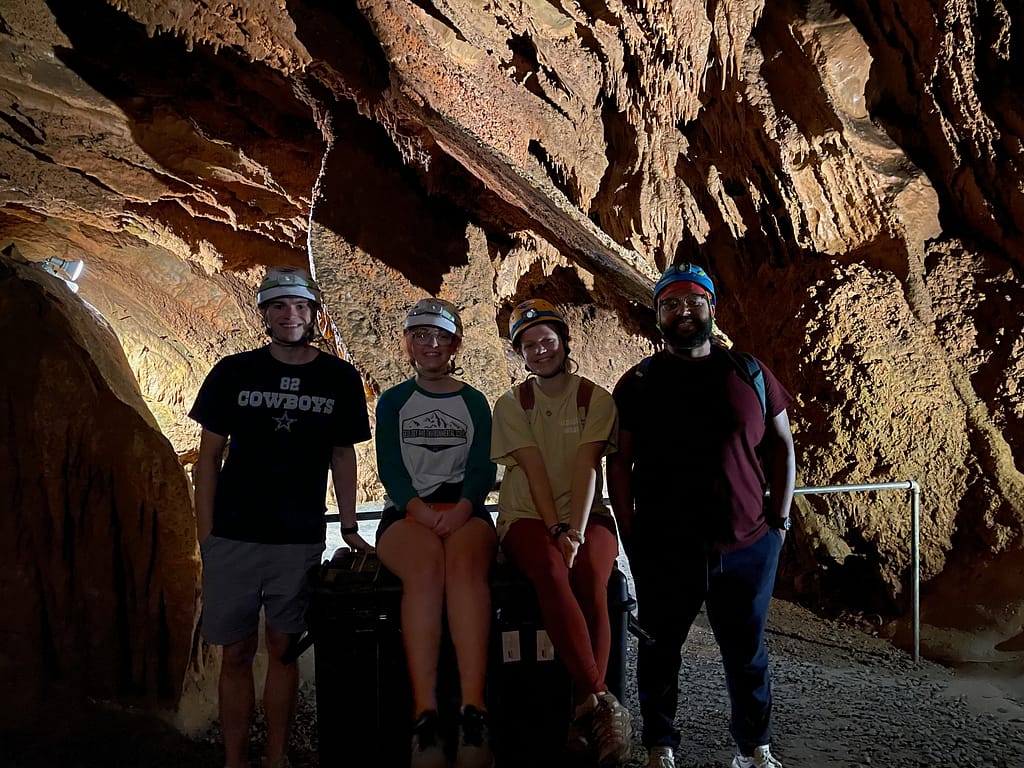
Zach Thomas, Lorelei Dellevedora, Lily Whitman and Angel A. Garcia Jr.
If you’d like to learn more about how GeoSLAM solutions can help you, submit the form below.
Scanning a Caribbean hospital with the ZEB Horizon to create a BIM model
Location
Otrobanda, Curaçao
Scanned
St. Elisabeth Hospital
Size
22,346 Square Meters
Scan time
20 minutes per scan
Industry
Surveying
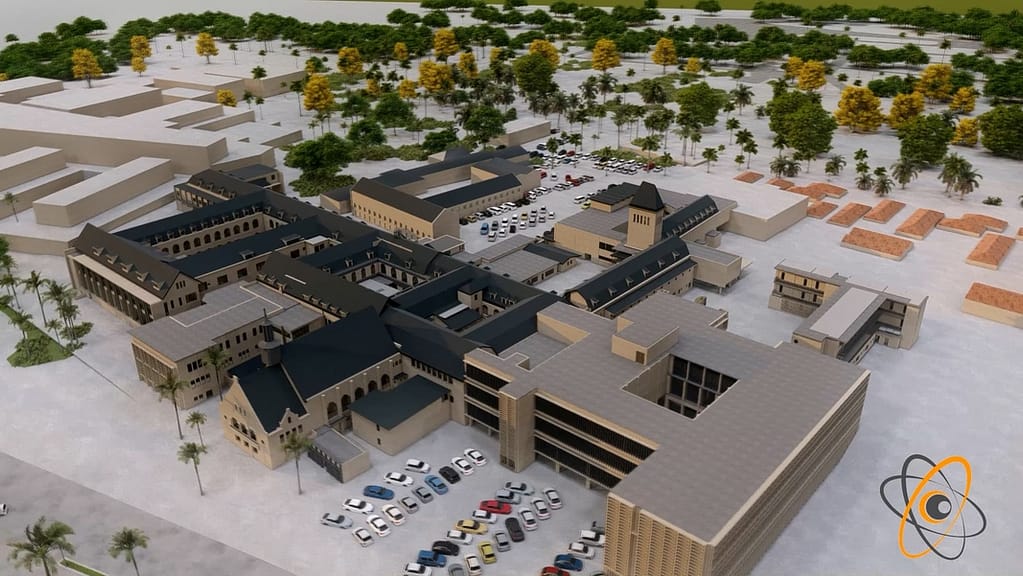
St. Elisabeth Hospital | Providing healthcare to a Caribbean Island
Constructed in 1855, with the help of the Franciscan sisters, the St. Elisabeth hospital has played an important role in the Otrobanda City district on the Caribbean island of Curaçao, for over 160 years. The large hospital served as the main hub for medical care, and was historically used as a place of healing for other island nations nearby.
Having been deemed no longer fit for purpose according to international standards in 2011, it was decided that a new hospital would be constructed next to St Elisabeth’s, and in 2019 the Curaçao medical center was opened to the public. St. Elisabeth hospital was closed in November 2019, after 164 years of service to the island.
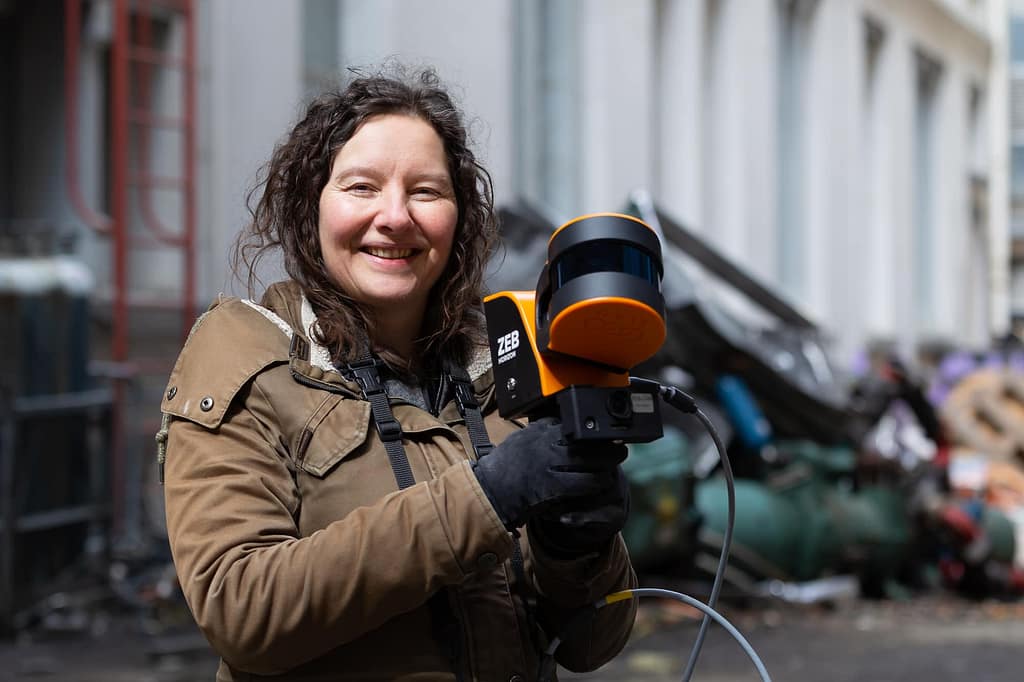
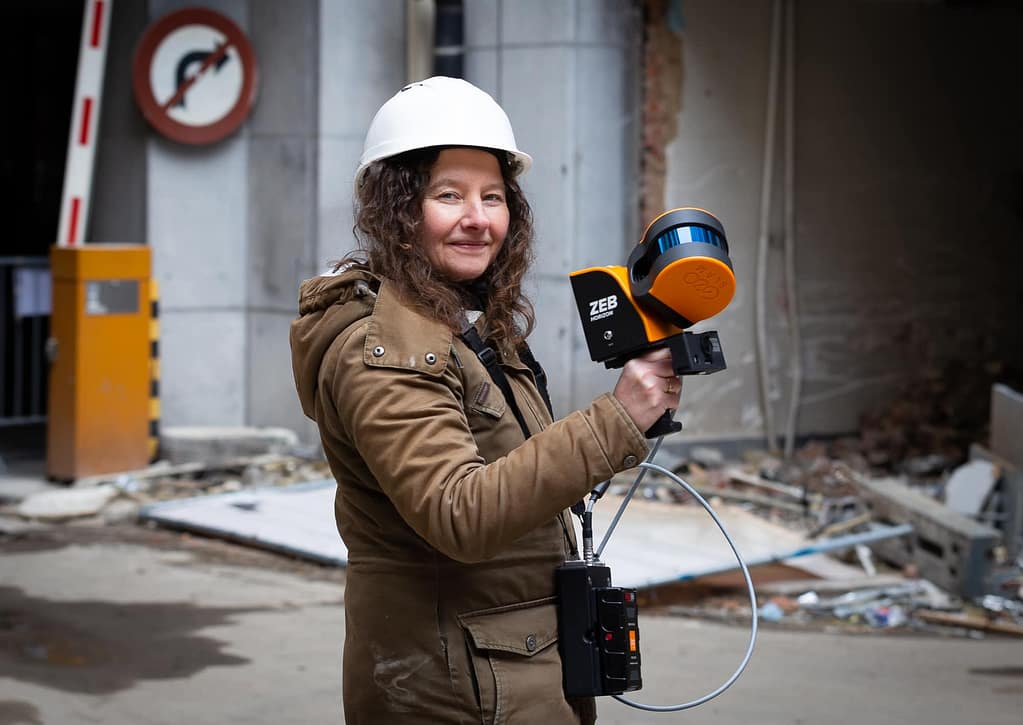
In 2021, Ellen de Brabander, from Urban Studio, was appointed by the survey bureau ‘Landmark’ with the task of scanning the hospital, in anticipation of renovation projects. Ellen chose the ZEB Horizon for the task, and later created an accurate BIM model using the point cloud data. In addition, Ellen is working on creating a virtual tour of the hospital, so it can be entered and explored from anywhere in the world.
Scanning with the ZEB Horizon
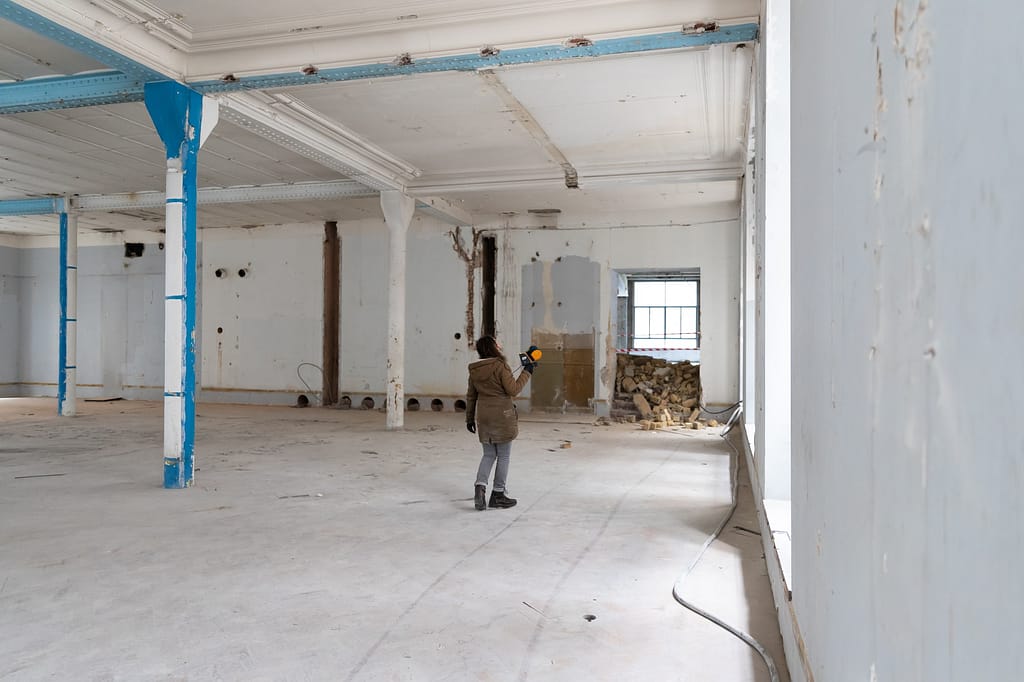
Due to the large complex nature of the building, with several floors and many individual rooms, the task of capturing and measuring the hospital was an enormous one, in terms of time frame. Originally Ellen was going to scan the building using a total station, however because the hospital is broken into 6 sub-buildings, an average of 3 floors per sub-building and many individual rooms per floor, the total station was quickly ruled out. Furthermore, with difficult to access areas, the bulky nature of a tripod-based system would not be ideal for capturing the hospital in its entirety, or fast enough.
After assessing the options, the team decided the best way to capture the building would be to use a mobile 3D scanner, due to the lightweight nature, speed of capture and ease of use. Ellen chose a ZEB Horizon for the job and was able to seamlessly walk through the hospital’s complex buildings, capturing data as she moved.
The 3D scanner of GeoSLAM was able to reduce the time of the measurement and as a result the delivery time was met. The measurement time would normally take several months, which was reduced to days
Having decided on the ZEB Horizon, she was able to capture both the interior and exterior of St Elisabeth’s hospital in just 6 full working days, which was an extremely short amount of time compared to traditional measuring equipment. 52 scans were conducted in total, at approximately 20 minutes per scan and the area covered (including exterior and interior) was 22,346 square meters. The complex nature of some of the spaces were captured effortlessly because of the manoeuvrability and compactness of the scanner.
Post scan
The scans were processed and merged using GeoSLAM Hub before they were converted in Autodesk Recap and taken into Autodesk Revit to be modelled. The model of the hospital was sent to the client and the process from capture to model was documented in a video, which can be seen here:
If you’d like to learn more about how GeoSLAM solutions can help you, submit the form below.
Creating a digital twin of Cistercian Landscapes
Industry
Education
Scan time
3.5 hours
Location
Franconia, Germany
Size
3 hectares
Scanned
Cistercian Landscapes
Professor Hess and Carla Ferreyra | University of Bamberg
Background With the adoption of digital technologies such as laser scanning, photogrammetry and other digital tools becoming ever more prevalent in conservation and preservation; it is easy to see why, in 2017, the University of Bamberg launched a new master’s degree, ‘Digital Technologies in Heritage Conservation’. Spearheaded by Professor Mona Hess, the course covers the integration and adoption of digital technologies in heritage conservation and its further development, as well as raising the profile of this research topic. In addition to running the course, Professor Hess and her team often employ their skills and expertise in the field, creating 3D digital models for preservation purposes, to build knowledge of certain areas or to educate a wider audience about a new culture.
“The 3D recording is a methodological tool for the representation and interpretation of cultural heritage, landscape and architecture, to build knowledge, create meaning and make culture accessible to all.“
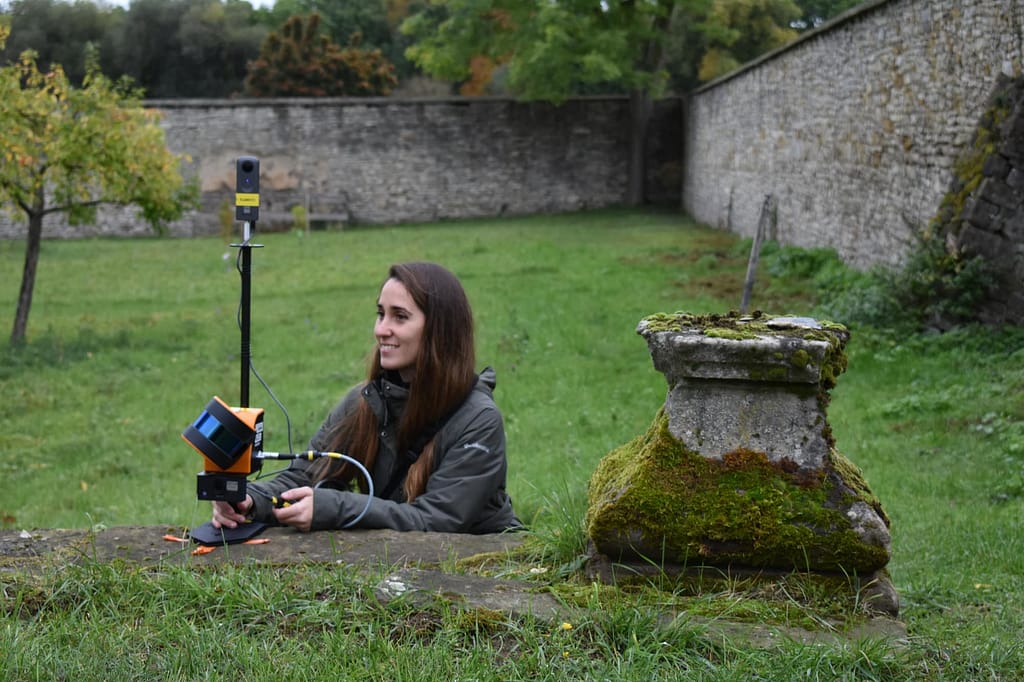
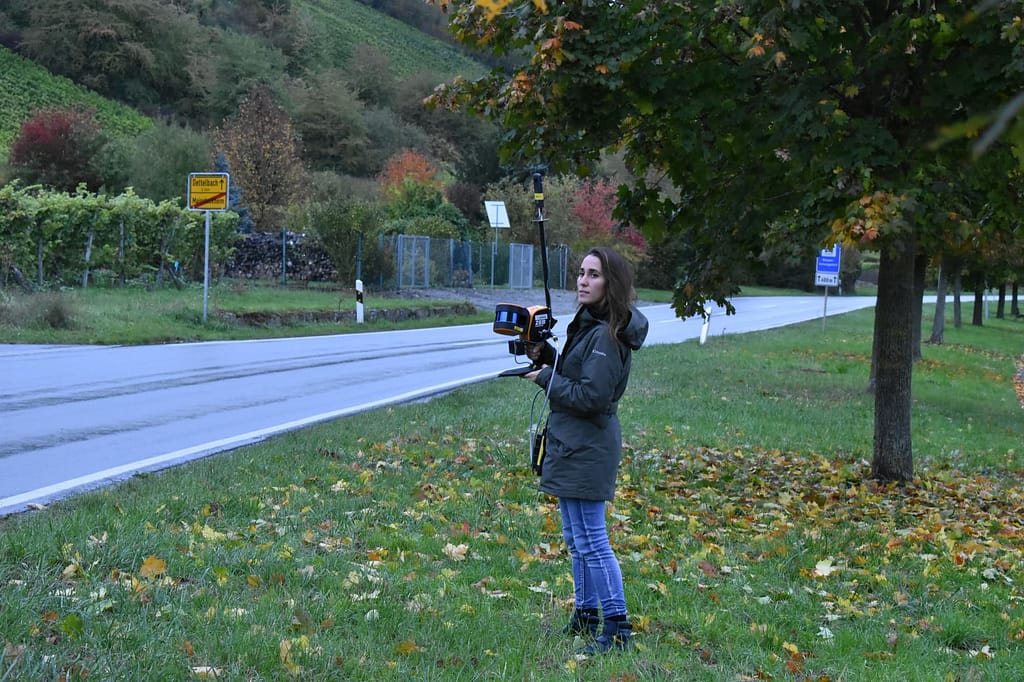
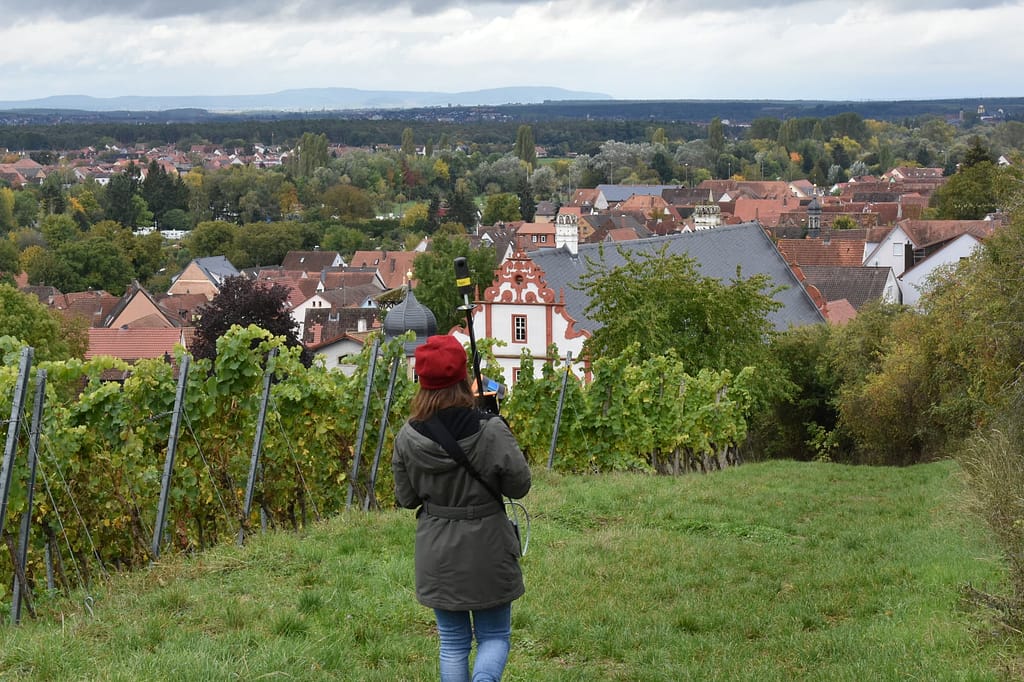
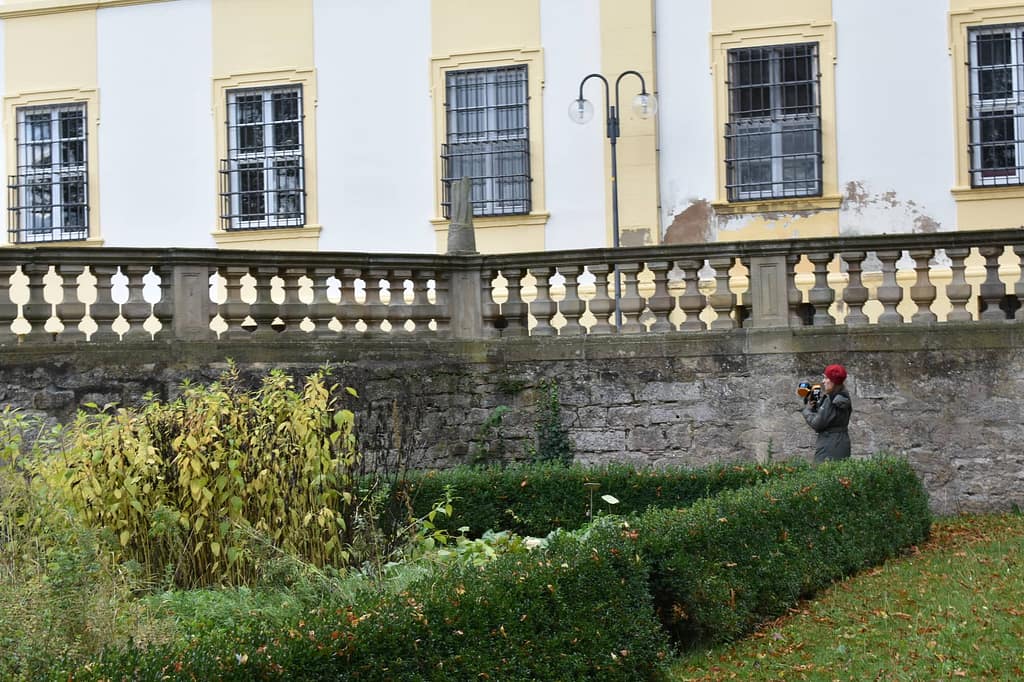
The Scan In 2020, Professor Hess was approached by ‘Cisterscapes | Cistercian Landcapes in Central Europe’ and was tasked with contributing to the digital recordings of 2 gardens. The scan would focus on the baroque agricultural buildings with designed gardens; Ebracher Hof in Mainstockheim and Ebracher Hof in Oberschwappach, both properties of the Ebrach Monastery.
The aim of the scan was to create reliable information, assess the landscapes development status and design management plans for maintenance and conservation. Professor Hess, accompanied by PHD student Carla Ferreyra, visited the sites in October 2020 to conduct the scans. With approximately 3 hectares of land to cover, the team needed a SLAM scanning solution that was quick, easy to use, suitable for both indoor/outdoor use and a solution with reliable results. Professor Hess chose GeoSLAMs ZEB Horizon with the ZEB Pano, because of the rapid data acquisition throughout the site up to 100m.
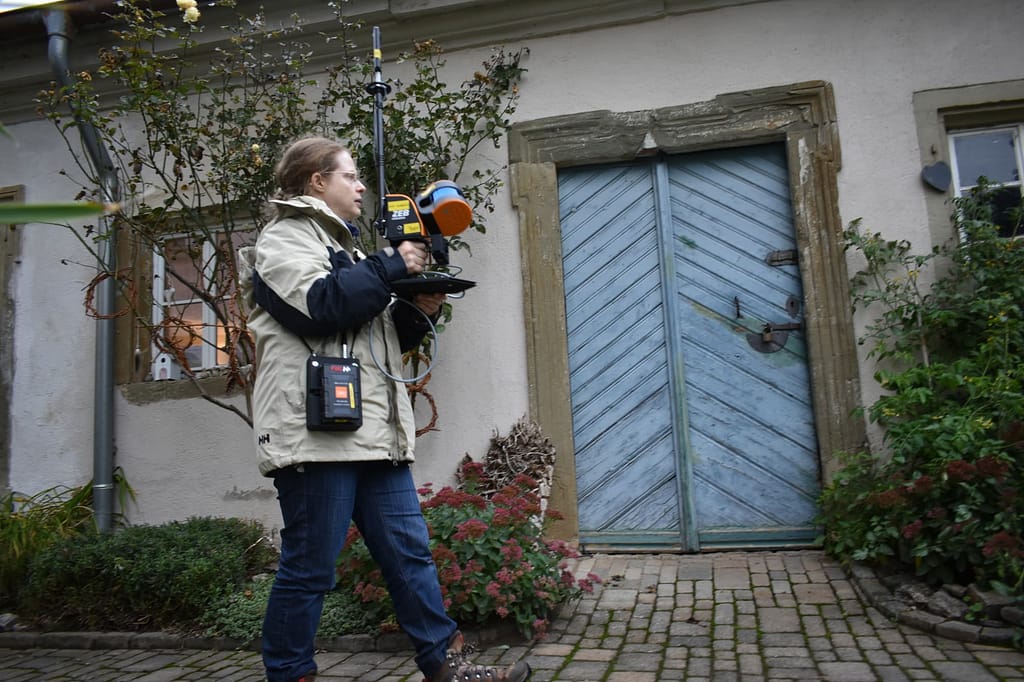
Other laser scanning techniques were considered in the planning process, however none quite provided the freedom the ZEB Horizon did, often with restrictions around mobility and time. In September 2020, a similar scan had taken place using a terrestrial laser scanner (TLS) of a specific area of the Mainstockheim garden. In comparison, the GeoSLAM scanner reduced the time and labour costs when completing the scan. The team were able to complete their scan of Mainstockheim (including an interior space of the baroque building) in just under 3 hours.
In Oberschwappach, the total scan time was approximately 30 minutes. Their only concern during the scan was encountering the general public, however due to the lightweight nature of the ZEB Horizon and Pano, it was easy to avoid busier parts of the garden. Where they did encounter other guests (due to their curiosity over the scanner) Professor Hess and Carla simply repeated the scan of that specific area. All in all, the scan was a success, and Professor Hess and Carla were able to deliver on their task.
The Results With the completion of the scan, not only does Professor Hess have fresh scan data that can be used to educate the next generation on how digital technologies can be used in heritage conservation, but they are also being used to extract 2D information, such as orthophotos, plans and sections in 1:50 scale and BIM models. Furthermore, videos of the scan were created – these serve as informational and educational pieces of content. Finally, the scans serve to raise awareness of these historic gardens, promote a scientifically accurate recording and also makes the heritage accessible to all. Professor Hess is currently using the scanner and scans for research & teaching, and she has observed that a lot of her students are enthusiastic about the speed of the process.
Looking Forward In 2021 Professor Hess is looking to extend the project further at Ebrach Abbey and the gardens, to contribute to the Cistercian Cultural Heritage project. Additionally, she is looking to create a digital twin model of a historic city using the ZEB Horizon, to research semantic 3D city models with information about urban heritage in the project ‘BIM to Twin’.
GeoSLAMs German dealer, Laserscanning Europe, were recently tasked with scanning a 70m deep cavity in a mine 500m below the earths surface. Using the ZEB Horizon on a cradle, Laserscanning Europe were able to successfully and safely capture the data, and this is their account of the job.
Data captured by Laserscanning Europe
Scanning with the ZEB Horizon | Words by Laserscanning Europe
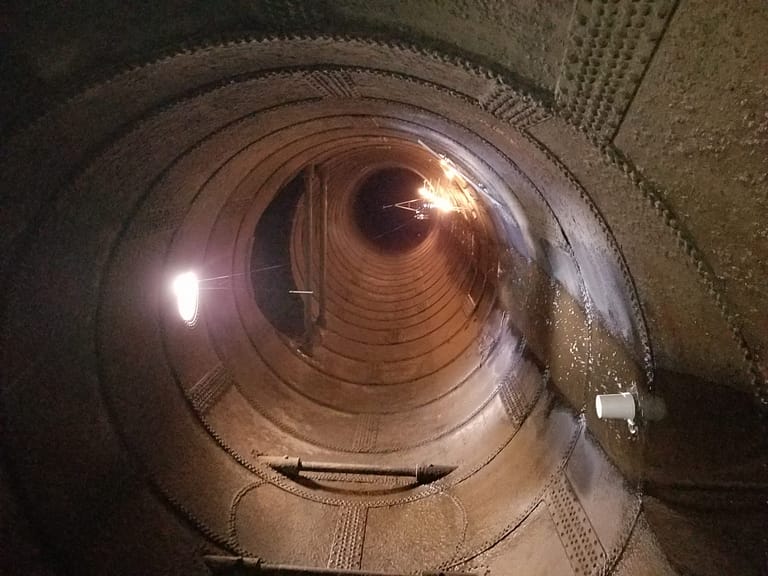
The object of measurement is located in the Hattorf/Wintershall mining facility of the company K+S Minerals and Agriculture GmbH. This is a cavity (underground, vertical conveyor system) about 500m below the earth’s surface with a depth of 70m.
The cavity no longer has the original storage volume due to material deposits from years of operation. The environment is dusty and it is expected that material will be deposited within the conveyor system at any time. In addition, the cavity is not accessible to humans from any opening and access is only possible through 1m diameter openings.
The objective was to obtain a three-dimensional survey of the conveyor system with highest possible resolution for inspection of the systems condition. Furthermore, strict compliance with all work safety regulations, with minimal risk for the measuring team, was required.
For this job, a mobile laser scanner was used. Thanks to its specifications, the GeoSLAM ZEB Horizon is ideally suited for the special conditions underground. The scanner is also suitable for surveying a cavity that is only accessible from above through a narrow shaft.
The scanner was mounted on a cradle, which was modified to minimise rotational movements when lowered. A 50m rope was attached to the cradle, which was used to lower the measurement system into the cavity.
Furthermore, trained members of the mine rescue team were on site to provide security and enable the scanner to be lowered and retrieved safely.
Measurement Procedure
01
Preparation of the survey: mounting of the scanner on the cradle and mounting of the rope system for lowering and raising the scanner
02
Starting the measurement at the upper end of the opening to the cavity
03
Lowering of the scanner, 50m deep, while the ZEB Horizon captures data
04
Raising the scanner, 50m high, while the ZEB Horizon captures data
05
Finishing the scanning process at the upper end of the opening to the cavity
06
Ascent from the mine and analysis of the scan data in the office
Workflow of the analysis
Following the survey, the scan data was processed using the GeoSLAM HUB software. The raw data, i.e. the processing of the point cloud from the data of the laser sensor and the IMU, is automated as much as possible. In the case that a scan was not automatically processed (e.g. because few geometric changes are found in the object space), the focus of the SLAM algorithm can be influenced by adjusting various parameters. Once the data has been run through GeoSLAM Hub, a complete point cloud of the cavity is available in .laz format. All other common point cloud formats can also be exported with little effort.
Since the scanner could only be lowered linearly on the rope, the earth deposits shadow smaller areas inside the cavity.
Results
The result of this scanning is impressive. This cavity, which is not accessible to humans, was successfully surveyed with the help of the GeoSLAM ZEB Horizon. The point cloud documents the dimensions of the cavity according to the requirements. Further missions with the GeoSLAM ZEB Horizon with similar objectives are already being planned and implemented.
Virtual Singapore– creating a dynamic 3D city model
Industry
AEC
Time
100 hours
Location
Singapore
Size
376 ground floor void decks
Scanned
Apartment blocks
Singapore is home to some of the most profitable financial services, manufacturing and oil-refining corporations in the world. But with its accomplishments come some very specific challenges for a city-state which is limited by space but still demanding growth.
Determined to future-proof Singapore’s success, the country has embarked on one of the most ambitious digital twinning projects the world has ever seen – creating a dynamic 3D city model and collaborative data platform, including 3D maps of the region.
At the initial stage of the project it quickly became apparent that aerial imagery alone would not be able to capture ‘void decks’ – open spaces typically found on the ground floor of the city’s apartment blocks. These areas, which are sometimes underneath the tower block structure, are used for everything from games areas, bicycle parking, hosting wedding receptions and wakes, and, as estates grow, facilities such as shops, medical centres and even schools.
In the face of fierce competition, GeoSLAM’s ZEB Revo was selected as the most innovative and efficient solution to collect data from these important community spaces.
“A huge time saving exercise which would ordinarily have taken 40 times longer using traditional surveying methods“
With a handheld “go-anywhere” ZEB Revo, field teams quickly captured a dense and accurate point cloud of an entire void deck, which was then used to model the deck geometry and incorporate this into the existing building models.
376 buildings with void decks were scanned using the ZEB Revo, taking approximately 100 hours – an enormous time-saving exercise which would ordinarily have taken up to 40 times longer using traditional surveying methods.
The ZEB Revo is often used alongside terrestrial hardware as the products are highly complementary. The data output can be easily combined through geo-referencing or scan-to-scan matching and then used to build complete 3D models. In this instance, the combination delivered highly detailed and rapid results while significantly minimising costs too.
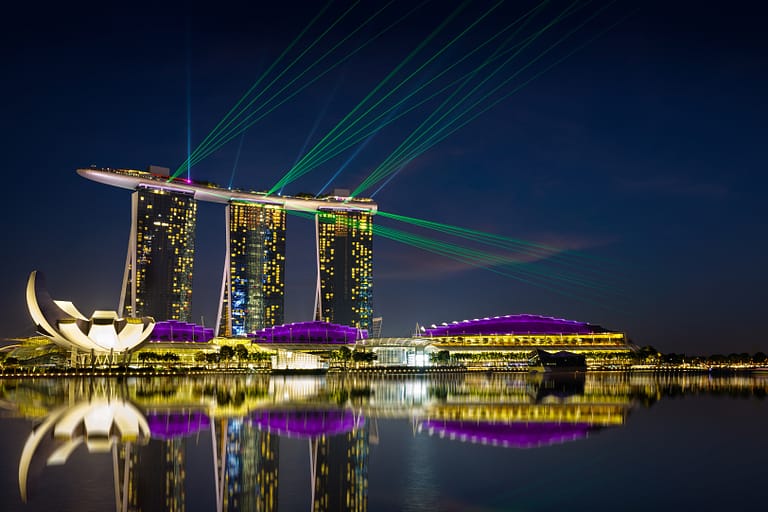
Beautiful laser show at the marina bay waterfront in singapore
Virginia Tech scan WW1 battlefield terrain in France
Location
Vauquois, France
Scan time
Three times faster than terrestrial scanners
Size
Several Kilometers
Scanned
Battlefield Tunnels
Industry
Education
Mapping WW1 Tunnels in Vauquois, France
The Vauquois battlefield in France tells a little-known story of mining warfare during World War I. This area went through 4 years of combat which saw the hilltop village of Vauquois completely destroyed. In addition, French and German troops dug miles of tunnels under each other’s positions. This meant they could plant explosive mines to ‘bomb’ the enemy from below. Consequently, this bombing left underground WWI tunnels in Vauquois.
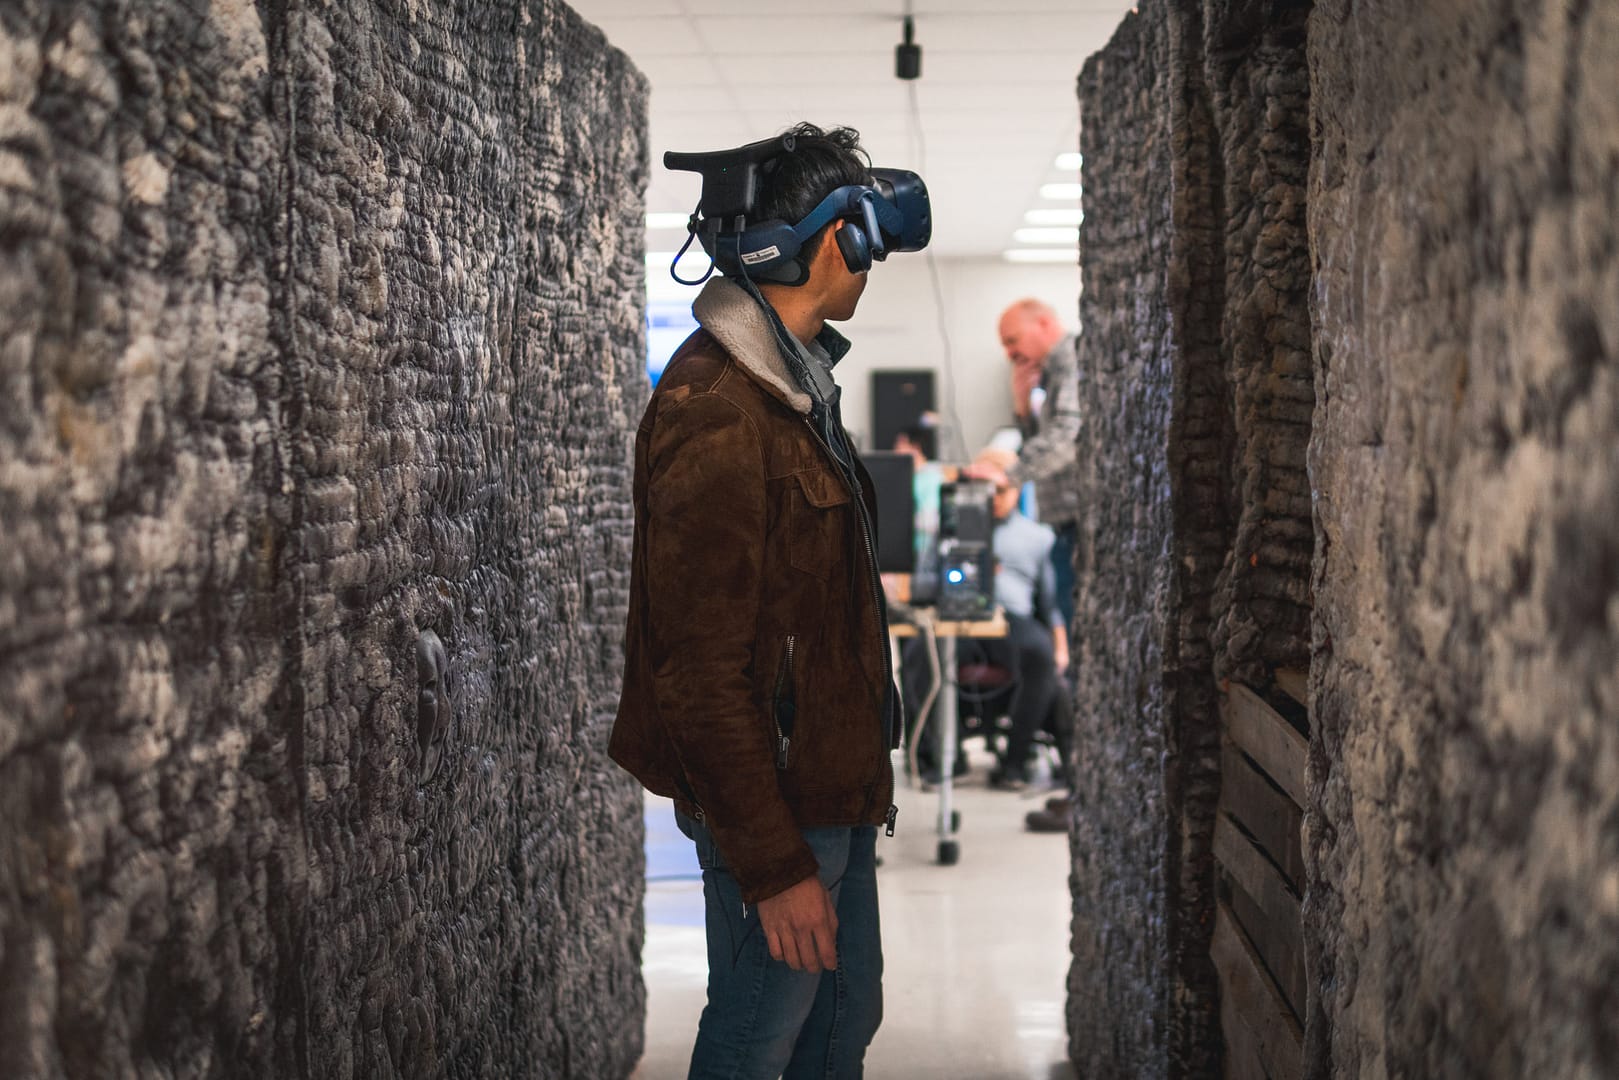
The WWI tunnels in Vauquois must be experienced first-hand to understand the difficulties and despair of living deep underground. Moreover, in wet, cold and cramped conditions for days at a time. Of course, not everyone can travel to France and crawl through the remaining tunnels in person. A group of researchers at Virginia Tech brought the battlefield to classrooms and museums with the help of reality capture and virtual reality (VR) technologies.
The WWI Tunnel’s Extensive Cramped Spaces
Combining efforts of the University Libraries, the Department of Visual Arts and numerous other disciplines, the Visualising History team travelled to Vauquois with funding from a federal grant in 2016. Over 10 days, they used traditional static scanning methods to capture details of the battlefield terrain.
However, when they attempted to scan inside the tunnels, their progress slowed down considerably as there were tight spaces that their scanners could not get into, which made the data capture process extremely time-consuming.
Scanning difficult to access areas with the ZEB Horizon
Before their next trip to France, the team acquired a 3D handheld laser scanner, GeoSLAM’s ZEB Horizon, with the hopes of making their time on-site more time efficient.
Due to the ZEB Horizon’s ease of use and speed of capture, the team collected scan data inside the tunnels more than three times faster than with the traditional stationary scanner. The time it took to scan the tunnels was crucial, as they were working on a budget, and the ZEB Horizon enabled them to do more with the time and money they had available. They also used the ZEB Horizon above ground, scanning the narrow trenches, wide bomb craters, and a church foundation.
The ZEB Horizon also proved to be more efficient as its software processes the data into a point cloud quickly. This meant that the team where able to see where data was missing, and go back and collect it, whilst still on-site. This created a much more accurate and complete virtual environment.
The ZEB Horizon was a gamechanger in terms of the speed of data acquisition.
Building the WWI Tunnels with the ZEB Horizon’s datasets
The Virginia Tech team engaged the expertise of students and faculty from numerous departments – Visual Arts, History, Education, Computer Science, Mining, Engineering, and Cinema – to build a life-size model of a tunnel and generate the virtual environment of the battlefield. This allows students wearing VR headsets to ‘walk’ through the scene, experiencing it with both sight and touch.
The speed and accuracy of the ZEB Horizon are game changers for educational and historic preservation VR projects like this because of time and budgetary restraints. VR data processing is extremely time consuming, which means time saved scanning in the field makes grant money go farther in the computer lab. The result is a more realistic and believable experience.
Going further with 3D laser scanning
The Virginia Tech Visualizing History team is not stopping with creating educational experiences from their 3D data collection. They are beginning to apply their VR capabilities to other commercial applications of mobile laser scanning.
Smarter Spaces use GeoSLAM to scan hydroelectric dam
Industry
Asset Management
Time
1 hour scanning total
Location
New Brunswick, Canada
Size
3,000 ft
Scanned
Hydroelectric dam
Canadian 3D geospatial experts Smarter Spaces engaged in a partnership with the University of New Brunswick (UNB) to laser scan a tunnel in a hydroelectric dam – producing a point cloud model to be overlaid with photogrammetry.
The Grand Falls Generating Station is a hydroelectric dam built in 1931 on the Saint John River in the Canadian province of New Brunswick and is operated by the NB Power corporation. The dam’s tunnel is shut down every 4 years for maintenance, inspection, and future life cycle planning.
This presented Smarter Spaces with the opportunity to utilise the mobile, handheld GeoSLAM ZEB Revo to scan the tunnel – creating an accurate point cloud model. In four years’ time the process will be repeated – allowing for the first side-by-side comparisons of the tunnel’s performance to be made.
In addition to this, NB Power has started exploring whether to build a 100-megawatt generating station in Grand Falls to produce more clean energy. The corporation is carrying out environmental and geotechnical studies, site tests, and consultations with First Nations and local residents before applying for an Environmental Impact Assessment later this year.
“It was a simple case of ‘walking and scanning’ through the tunnel environment“
The tunnel is approximately 3,000 linear feet in length and, because of its unique geometry, proposed an interesting set of challenges to scan. The tunnel environment was found to contain a lot of moisture – with a small stream running through the base. The IP67-rated ZEB Revo – which began life in mining environments – is rugged enough for such environments. The tunnel was dark, visibility was low, and walking conditions were slippery and wet. Smooth-sided surfaces also cause data collection issues for mobile scanners.
Tunnels can often prove challenging environments for SLAM given they are low on features. The SLAM used by GeoSLAM performs even in this difficult condition.
To overcome the risk of data slippage, 4 foot-high pylons were placed every 10 feet in random locations throughout the tunnel. This has the effect of ‘breaking up’ the monotony of the smooth-sided tunnel walls, ensuring that no data slippage occurs.
The scan data was processed in GeoSLAM Hub software to filter, subsample and merge multiple data sets together. The final models and datasets were sent to the University of New Brunswick to support an engineering graduate with their thesis research.
Precision Property Measurements | Words by Greg Davis
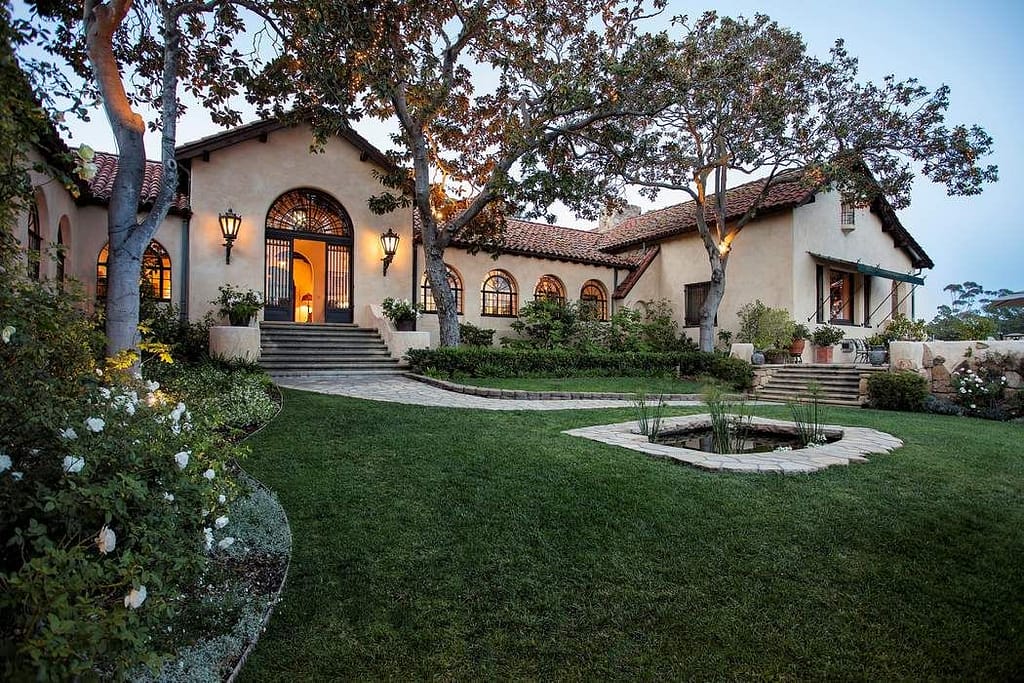
“We were tasked with surveying a vast private house in order to generate accurate as-built construction drawings for renovation. The unique challenge was that the 20,000 sq. ft Santa Barbara residence was occupied at the time, requiring the survey to be completed quickly and in an unobtrusive manner.
PPM (Precision Property Measurements) chose the ZEB Revo over other terrestrial scanners for our residential projects because of the speed and volume of data acquisition at exactly the level of accuracy required by our clients.
In order to keep disruption to residents to a minimum, we decided to tackle the task in two swift scans over two days. The first scan consisted of data collection of the extensive ground floor and communal areas, and took around 90 minutes to complete. The private, bedroom wing was off limits on this day.
The second scan incorporated these sleeping quarters, as well as gathering plenty of overlap from the lower floors to enable the 2 scans to be merged. After just 140 minutes of scanning, the entire house had been surveyed.
“We’ve always been confident in our ability to keep our projects to the nearest inch or less. In bringing the ZEB REVO into our arsenal of tools, we’ve kept the accuracy we’ve always had, but introduced an efficiency that allows our experts to get out there and do more for our clients“
A typical residential property of this size would have usually taken around 4 days on-site for one surveyor. PPM were able to slash this time and complete the majority of the survey work in less than 2 and a half hours with the ZEB Revo.
The use of GeoSLAM Hub software for post-processing and merging of the two datasets allowed the project team to generate a complete digital twin of the complex structure. GeoSLAM’s cutting edge mobile mapping technology was able to deliver an accuracy down to the nearest inch.
Handheld mapping reduces skyscraper scan time by 30 hours
Industry
Architecture
Time
10 hours
Location
Belo Horizonte, Brazil
Size
8,357 sq/m
Scanned
Skyscraper
Paragram | Words by Jose Vargas
“In the city of Belo Horizonte, there is a distinct mix of contemporary, classic and historic buildings on display, making it a really attractive destination to visit. What comes with the architecture on offer however, is the need to preserve it for tourists and future generations to enjoy.
Often the fragility of buildings or lack of resources means that many buildings go untouched for decades, leaving them to crumble. It’s my job to ensure these relics remain.
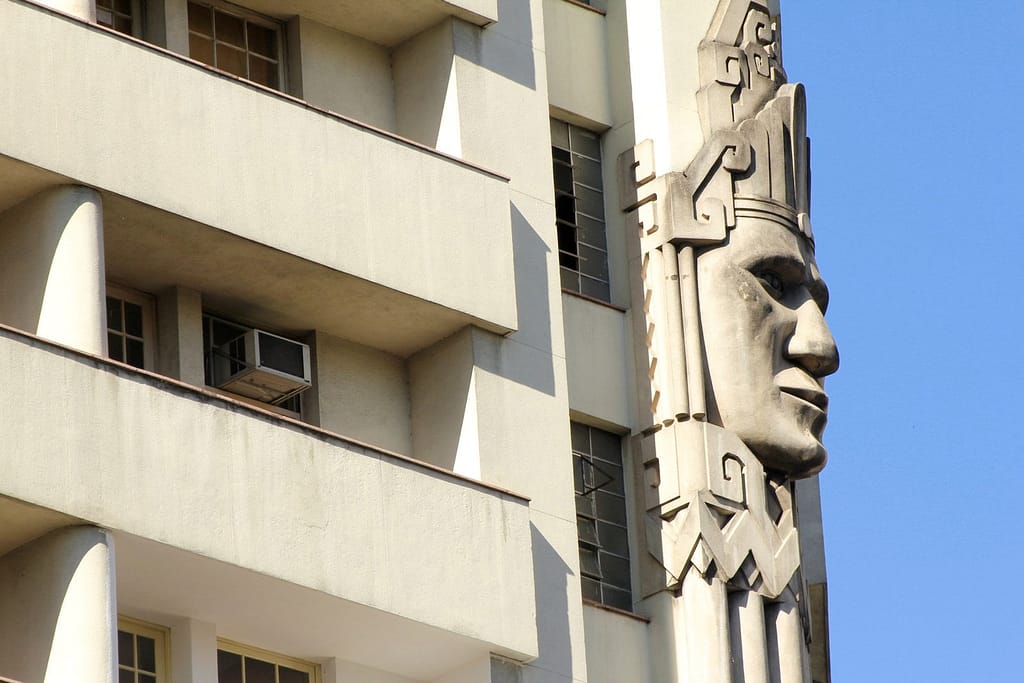
When the chance to retrofit electrical installations and a fire prevention plan to a 130-metre art deco skyscraper, the Acaiaca Building, became available, the team at Paragram knew we had to be involved.
“We were very impressed with the quality of information captured by the ZEB Revo.“
Built in the 1940s and once used as a nightclub, cinema, shops and air-raid shelter, the building required some attention in order for it to meet safety standards. Having initially planned to measure the 8,357 square metre building using manual survey methods, estimates told us this would have taken three employees over 40 hours to complete an as-built structure.
Working alongside contractors at Criar Projetos E Consultoria, Paragram decided to use GeoSLAM’s ZEB Revo, known for its ability to quickly generate images to within a few centimetres of accuracy. With the handheld device, the job was expected to take around 10 hours in total, reducing the workload dramatically.
Acaiaca Building
With just two operatives and in under 10 hours, we managed to complete a scan of the building’s interior, with one walking through the building holding the device and another taking a photographic record. This innovative way of working meant we were able to gather much more information than first anticipated, including the registration of beams and roof trusses, electrical installations and engine room areas.
“The ZEB Revo is a real game changer for the architecture industry.“
As a team, we were very impressed with the quality of information captured by the ZEB Revo, which was easily incorporated into a BIM representation using Revit software.
Almost every renovation project is governed by strict time constraints, but with GeoSLAM’s device and its ability to rapidly scan large areas, it is a real game changer to our industry. With products like this at our disposal, I am excited about what the future will hold for heritage buildings in need of a little TLC.
Bloom Cloud Engine is a powerful on-premise point cloud editor ideal for use in Design, Fabrication, and Construction applications. Easy to deploy across your project team, BloomCE allows users to optimize and condition the point cloud data from all reality capture modalities, providing the fundamentals for Asset Management and Digital Twin project requirements.
Blacklight, based in Romania, focuses on information technology that captures, measures and visualises data used in various fields of activity through providing valuable solutions.
Cybernetech Corporation, based in Japan, is a specialised trading company that offer advanced information and communication equipment and geospatial information technology.
Seiler Instrument is an American company that specialises in distributing surveying software and instruments serving industries such as surveying, engineering and construction.
Favre, Développement & Foresterie, based in Switzerland, are experts in geomatics and work with public and private landowners for forest management and environmental heritage.
3DT Digital Manufacturing is an Australian company that use the latest technology to adapt to changes in real time. It aims to help their customers become more efficient and productive.
Sigma Mascot, based in Hong Kong, provides solutions for 3D Laser Scanning, Geospatial systems and BIM services for industries such as Forestry, Construction and Real Estate.
Precision Laser & Instrument is an American company that offers comprehensive positioning solutions for the Construction, Survey, and GIS industries. They ensure high returns on investments and business success.
Export your point cloud into a range of formats, including LAZ, LAS, PLY and TXT. Datasets can also be exported as structured or unstructured E57 files, both of which include embedded panoramic images.
Surface normals at each point can now be computed from PLY and E57 formats, allowing users to export colourised data and create a high-quality polygonal mesh in third party software .
Stop and Go Georeferencing
Known control points are captured during a scan and automatically compared and matched to the associated coordinates during the processing stage in Connect. A rigid and/or a non-rigid adjustment can be made to the dataset and an accuracy report is exported, highlighting how successful the transformation was. Users can now view and manipulate the processing parameters to ensure a more accurate match between points.
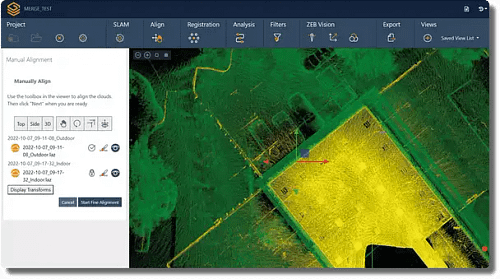
Manual Alignment
Align multiple scans using a combination of manual and automatic processes. This workflow can be performed on two or more scans in the same project. Users have a choice to export the aligned scans separately or as a single merged point cloud.
JP Interactive Viewer
Leverage your GeoSLAM data by integrating JP Interactive Viewer into your workflows. JPIV allows you to unlock the full potential of your reality capture data and distribute actionable insights across your teams.
Our support team will be available for GeoSLAM Care customers on:
Monday 26th, 8 am – 4 pm (GMT)
Tuesday 27th, 8 am – 4 pm (GMT)
Wednesday 28th – 31st December – standard support hours
Monday 2nd January, 8 am – 4 pm (GMT)
From Tuesday 3rd January – standard support hours resume
Test pop-up
fsikajntgfitdshagklndsakj;gnjkdasklngklsa
Click here to view the release notes.
Autodesk Recap
Autodesk Recap contains tools for the manipulation and interpretation of high quality point cloud data and to aid designers and engineers in their creation of 3D models for real-world projects and assets (e.g. buildings and other infrastructure). It’s integrated design features help to streamline workflows, for example Scan to BIM. Recap is used to create initial design projects that users can then take into other Autodesk modules (e.g. Revit, Navisworks, AutoCAD).
Autodesk Navisworks
Autodesk Navisworks is a comprehensive project review solution that supports co-ordination, analysis and communication of design intent and constructability. The software can be used as a common data environment (CDM) for multidisciplinary design data created in a broad range of Building Information Modelling (BIM) packages. Using the tools within Navisworks, users can anticipate and minimise and potential problems between the physical building and the structural model.
Autodesk Revit
Autodesk Revit is a building information modelling (BIM) software. It contains tools which allows for planning and tracking throughout the building’s lifecycle. The software also allows multiple disciplines to collaborate more efficiently and make more informed decisions early in the design process. As GeoSLAM’s hardware allows for quick data capture, the equipment can be used to scan any existing buildings with the purpose of using the data to produce a digital twin.
Orbit GT allows users to capture and manage available 3D data (LiDAR data and imagery), extract a range of features for map production and make data sharable. All Orbit modules are ready to be used with 3D data from indoor, oblique, UAS and mobile mapping projects with other extensions that can be added to the Publisher and Orbit Cloud. Orbit can be used with the ZEB Discovery solution.
ContextCapture
ContextCapture is a reality modelling tool, allowing for the import of any point cloud and imagery data for the creation of high resolution reality meshes. These realistic meshes are accurate representation in 3D with high resolution RGB values of any scanned environment. By using GeoSLAM data in ContextCapture the users are able to create indoor reality meshes, which has been never possible before.
Microstation
Microstation is a 2D/3D software for designing building and infrastructure projects. It includes building information modelling (BIM) tools to document and assess any type of asset throughout its lifecycle. GeoSLAM solutions are often used in Microstation in the underground mining sector and to assess the current stage of any built environment, update the design model, and generate BIM information.
Deswik
With the GeoSLAM Connect stop-and-go georeferencing feature, users can easily georeference headings from known positions and map for analysis of overbreak, underbreak, undercutting and blast roughness calculations. This information is used within Deswik Mapping to analyse headings and levels.
Esri
Outputs from GeoSLAM’s solutions can be input to Esri’s GIS programs and apps, including ArcPro, ArcDesktop, ArcGIS Online and ArcScene. Join point clouds with local geodata or classify and edit scans based on their geography and statistics.
Micromine is a detailed and diverse mining software that provides solutions including modelling, estimation, design, optimisation and scheduling. Once data is exported from Connect it can be imported into Micromine and easily converted into wireframes. These can be used in Micromine for further studies into volumetric slicing, over and underbreak analysis, geologic modelling, face mapping and many more.
Terrasolid provides tools for data processing of airborne and mobile mapping LiDAR data and imagery. It includes different modules for tasks like data manipulation, calibration, georeferencing, point cloud classification, modelling and many more. It is a very powerful tool for a variety of industries, surveyors, civil engineers, planners, designers. Full, UAV or lite versions of Terrasolid modules are available for both MicroStation or Spatix software. All GeoSLAM products are compatible with Terrasolid and GeoSLAM data can be enhanced and edited with this software.
Floorplanner
Floorplanner allows you to draw accurate 2D floorplans within minutes and decorate with over 150,000 items from kitchen appliances to tables and chairs. Data is exported from GeoSLAM Connect in PNG file format with a scale of 1cm per 1 pixel and can be taken into Floorplanner.
Unity
GeoSLAM 3D point cloud data can be imported into Unity 3D Game Engine to generate interactive 3D scenes, where users can create 3D BIM models with textures and explore the space in 3D photorealistic environments.
Unreal Engine
Although Unreal Engine is mainly built for developing games, increasingly users are starting to use it to develop VR applications for understanding the current conditions of buildings, infrastructure and similar. Unreal Engine with a point cloud plugin can be used to visualise GeoSLAM point clouds in VR, which allows for collaboration, simulation and the understanding of current conditions of any scanned environment. Additionally, Unreal Engine tools are completely free.
Veesus Arena4D
Arena4D is a software package for marking up, annotating and editing 3D point cloud data containing a various export capabilities. It has a powerful and simple to use animation package which allows users to visualise massive point clouds in a simple way. GeoSLAM data can be simply uploaded and used in this package for the assessment of the current conditions of any structure, comparing differences between captured data (as built) to designed model (as designed).
Pointfuse
Pointfuse generates 3D meshes from point cloud data and classifies them to building ceilings, walls, windows and other features in IFC format. By using GeoSLAM data with Pointfuse users can very quickly create a classified BIM model with minimal manual input or expertise needed.
MineRP
MineRP has a Spatial DB that uses GeoSLAM data to represent visually the real environment of the underground mine. The software uses other data layers to overlay information on the digital landscape for decision making and tracking.
Pointerra
Pointerra provides a powerful cloud based solution for managing, visualising, working in, analysing, using and sharing massive 3D point clouds and datasets. Pointerra allows users to simply visualise and interrogate GeoSLAM data from anywhere.
Nubigon
Nubigon is a software solution that allows users to seamlessly interact with large point clouds and create visualisations and animations. Take your GeoSLAM point cloud data into Nubigon to create eye-catching flythrough videos.
Here is an example of a visualisation created in Nubigon using GeoSLAM point cloud data:
SLAM Environmental Pre-sets
Common data capture scenarios, such as UAV, outdoor, indoor, linear, and vehicle, have been characterised in Connect and data processing pre-sets for each environment have been defined. These can be selected at the beginning of the data processing stage allowing this process to be highly simplified.
Closed and Open Loop Georeferencing
Both methods match the scan data from a ZEB Locate system with the GPS data collected from the antenna to georeference the point cloud. When a scan starts and ends in the same place, this is classed as “closed loop”. “Open loop” is when the start and end position of a scan are in different locations. Standard SLAM practices apply to both methods of data collection.
Open Loop SLAM for the ZEB Locate is available on request – let’s talk about it.
Stop and Go Alignment
Common static points are captured during several scans meaning that these datasets can be automatically aligned. A single point cloud is then exported as if the data was captured in a single scan.
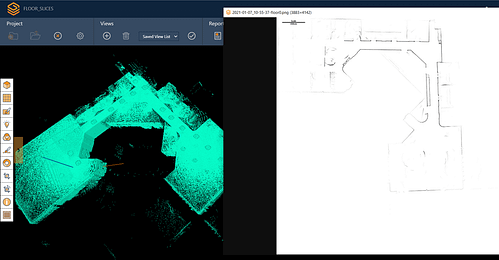
Floor Slices
Horizontal and vertical slices can be taken from any location within the point cloud. Horizontal floor slices can also be automatically taken at a given height above the floor as defined in the processing stage.
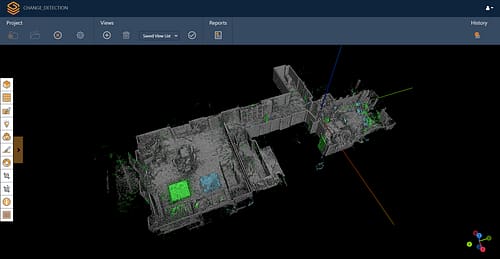
Change Detection
Mostly used in the construction industry, multiple point clouds can be compared and any areas that have changed are automatically highlighted. Point clouds can also be compared with CAD models – for instance to track progress on a construction site – and PDF reports can be generated to present this information.
Queued Processing
Import multiple .geoslam files into Connect for processing and the scans will be processed in the order they were imported. The size of the queue can be defined by the user.
Enquire about the ZEB Horizon RT
Error: Contact form not found.
If your internet connection allows, move the Point Budget slider to the maximum amount available to view all the points in the cloud.
Making the point size smaller using the Point Size slider makes the data easier to view and interpret.
In the tools section of the viewer, you can measure the distance and angles of features within the pointcloud.
Using the materials section of the viewer, you can use the Select Attributes dropdown to view by intensity, elevation and RGB (if pointcloud is coloured)
UK payment plan
UK payment plan info
USA Payment Plan
Coupling with hardware
Some SLAM software algorithms have been made available as open-source on the internet, but they are purely algorithms and not a product that you can take and use off-the-shelf. SLAM is most successful when it is tightly coupled and designed with specific hardware in mind. A generic SLAM cannot perform as well as one that has been specifically designed for a purpose.
Usage in multi-environments
Visual SLAM is closer to the way humans navigate the world, which is why it’s popular with robotic navigation. But in the same vein, vSLAM will have the same image-capture challenges as humans do, for example not being able to look into direct sunlight, or not having enough contrast between the objects picked up in the image. These can be overcome indoors, however, you may need to map a forest, tunnel or urban canyon. While SLAM technologies don’t rely on remote data (meaning you can scan areas where there is no GPS), you do need to ensure the SLAM technology you chose operate well inside, outside, in daylight and darkness.
Real-time data capture
Mapping a property is time-critical. Ideally, you want to make a single visit and gather sufficient data to create a highly accurate 3D model. Ensure the software you choose transforms 3D point cloud data into actionable information in real-time. This allows you to view and interrogate your data whilst still in the field, and make any adjustments, or collect missed data, then and there.
Flexibility and deployment
If you’re trying to map an enclosed environment (e.g. tunnel, mine) or a complex, difficult-to-access space such as a heritage building with tight stairwells and uneven floors, you need to use fully-mobile, adaptable technology. Wheel-based systems, often used with the vSLAM camera, will struggle with access. Handheld devices or LiDAR scanners that can be attached to a drone or pole and still deliver accurate results in a rugged environment are best for navigating hazardous spaces.
Speed and accuracy
While vSLAM is able to provide a qualitative high-level map and sense of the surrounding features, if you’re needing survey-quality accuracy and rich-feature tracking at a local level, you’ll need to consider LiDAR. Cameras require a high-frame-rate and high processing to reconcile data sources and a potential error in visual SLAM is reprojection error, which is the difference between the perceived location of each setpoint
and the actual setpoint.
Quality and distortion
In order to deliver the depth required for high-quality data, a number of depth-sensing cameras are needed with a strong field of view. In most cases, this isn’t possible, especially as cameras with high processing capabilities typically require larger batteries which weigh down airborne scanners, or limit the time of flight. LiDAR is both faster and more accurate than vSLAM, and can deliver detailed point clouds without expensive (and timely) camera processing.