Georeferencing takes centre stage for GeoSLAMs latest software release
Last Updated on 3rd March 2023 Georeferencing takes centre stage for GeoSLAM’s… Read More »Georeferencing takes centre stage for GeoSLAMs latest software release
Last Updated on 3rd March 2023 Georeferencing takes centre stage for GeoSLAM’s… Read More »Georeferencing takes centre stage for GeoSLAMs latest software release
Last Updated on 30th March 2023 What part does LiDAR play in… Read More »What part does LiDAR play in the Disaster Management Cycle ?
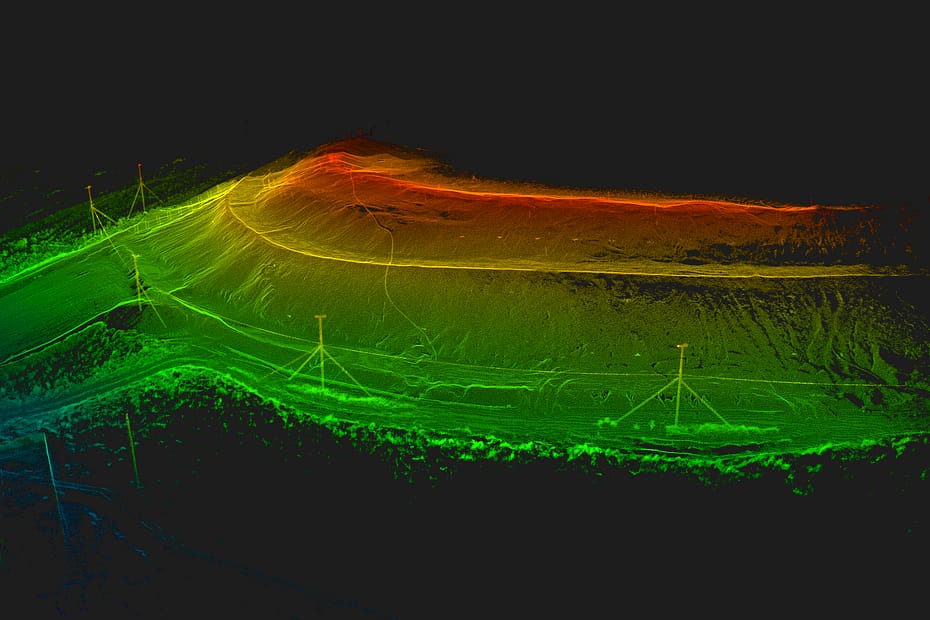
Location: Victoria, Australia
ZEB Scanner: ZEB Horizon
Scan time: 10 Minutes (via car)
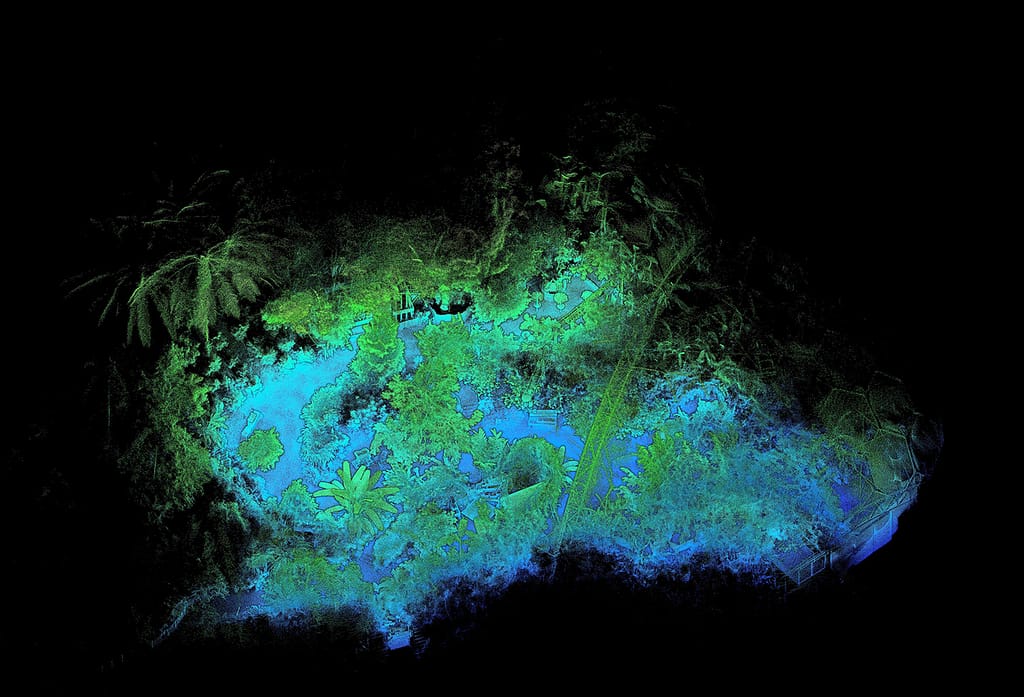
This data was captured using the ZEB Horizon and car mount. The point cloud visually shows clash detection between the powerlines and the overhanging trees.
Would you like to see a specific dataset that’s not on this page? Contact [email protected]
Location: Sydney, Australia
ZEB Scanner: ZEB Horizon
Scan time: 5 Minutes
This data was captured using the ZEB Horizon in just 5 minutes and consists of 7.7 million points.
Would you like to see a specific dataset that’s not on this page? Contact [email protected]

Last Updated on 2nd December 2022 How LiDAR is becoming an essential… Read More »How LiDAR in forestry is becoming an essential tool

Ås,
Norway

Approx. 10-20 minutes per scan

250 Sq/m plots

Norwegian forests

Forestry
The SFI SmartForest is a part of the Centres for Research-based Innovation scheme of the Research Council of Norway. It aims to position Norway’s forestry sector at the forefront of digitisation by 2028. The primary goal of the 8-year research centre is to improve the efficiency of the Norwegian forestry sector by enabling a digital transformation, using innovative technologies, such as LiDAR. They aim to increase productivity, reduce environmental impacts, and review other significant climate benefits.
SmartForest are focusing on silviculture, forest operations, wood supply, and the overall digital information flow. The hope is to bring industry 4.0 to the Norwegian forestry sector by having a free flow of information and real-time communication, through innovative and enabling technologies.
The interconnectivity of data and technology will not only result in the long-term success of the forestry sector in Norway but also contribute to limiting potential environmental impacts.
LiDAR is one of the enabling technologies that will help them collect accurate data for ground truthing. The point cloud is forming a basis for deep learning models that can eventually apply to much larger mapped areas.
The forest is dense with trees, the floor is often rough terrain, and it is usually hidden beneath a thick canopy of vegetation. To capture 3D models of the forest, SmartForest need a mobile LiDAR solution that can map from the ground and a UAV-based LiDAR solution to capture properties of the tree canopy.
Data acquisition is only one part of a larger workflow that can include segmentation algorithms, allowing for further exploration of the physical attributes of individual trees such as tree height and distribution. It’s important for the data to be precise, to ensure accurate monitoring of the forest.
An obvious solution was a static-based terrestrial laser scanner (TLS), however, despite the accuracy levels being incredibly high, the speed of capture was impeded by the need for several scans in one area. As the project progresses and the need for scanning larger areas increases, TLS becomes a less likely option.
Another choice was a UAV-based solution that can capture large areas in a short period of time. Though SmartForest works with UAV to capture the forest canopy, it’s less effective at penetrating thick vegetation to collect forest floor and trunk data than it is from the ground.
After looking around the market, they opted to try mobile laser scanning as a solution that could quickly capture ground data to an accuracy high enough for their needs.
Vegetation, trunks and terrain
Trunks and terrain
Terrain
SmartForest chose GeoSLAM’s ZEB Horizon scanner for its speed of capture, ease of use, and mobility. Projecting 300,000 laser points per second with a range of up to 100 meters, the scanner produces dense point clouds of large areas, in a short period of time. The accurate point cloud includes the forest floor, debris, tree trunks, and thick vegetation.
Frequent data acquisition is a key part of SmartForests plans and GeoSLAM’s handheld LiDAR scanner, alongside UAV data capture help to achieve this. The ZEB Horizon’s ease of use makes data acquisitions a repeatable task and the high accuracy of data provides a foundation for deep learning models.
The point clouds are processed in GeoSLAM’s software package and imported in 3rd party solutions, where sophisticated algorithms are applied to segment the data. Automatic segmentation of the tree trunks allows for easier tree counts and tree segmentation provides precise forest inventory, down to the individual tree. The digital separation of trees will lead to the extraction of features such as wood quality, biomass, and other ecologically relevant variables.
Scanning with the ZEB Horizon is a very efficient way to collect ground truth. Eventually, we want to use it for large-scale mapping applications.
The long-term plan for the SFI SmartForest is to bring industry 4.0 to the Norwegian forestry industry, using emerging and enabling technologies. Handheld LiDAR scanning has been identified as an efficient way to map the forest from the ground, providing accurate point clouds which serve as the basis for deep learning research opportunities.
They hope to use GeoSLAM’s ZEB Horizon for other applications in the future, having seen the versatility of the scanner.
If you’d like to learn more about how GeoSLAM solutions can help you, submit the form below.
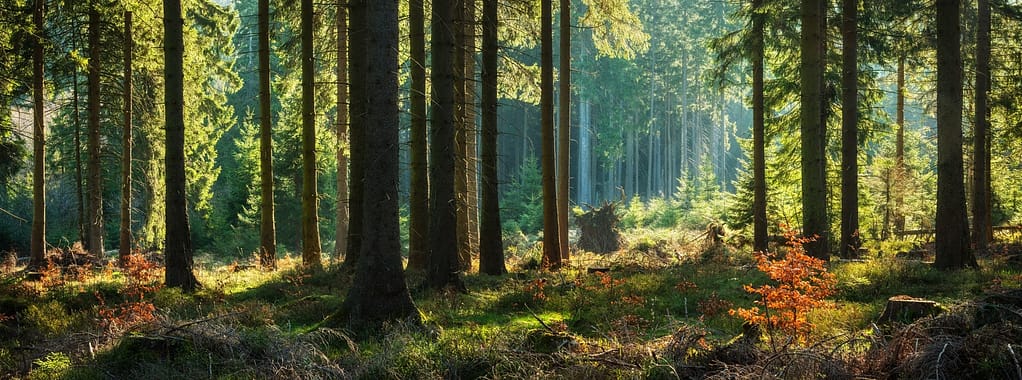
Location: Sherwood Forest, Nottingham
ZEB Scanner: ZEB Horizon
Scan time: 11 Minutes
This data was captured as part of the Big SLAM Tour of the UK, read about it here.
Would you like to see a specific dataset that’s not on this page? Contact [email protected]


Industry
Conservation
Scan time
9 minutes
Location
Čakovec,
Croatia
Size
1km in
length
Scanned
Forest
Geocentar | Words by Luka Zalovic
“47% of Croatia’s total land area is covered by forest, an area of approximately 25,000km2 . Management of these vast valuable assets is a key industry in Croatia and across its central European neighbours. As well as managing the biodiversity and sustainability of the forests, it is important for commercial logging companies to assess the quality and biomass of the forests for responsible timber sales. This assessment is a growing need – every year, Croatia adds 10.5 million m3 of forestry to its stock.
Methods of forestry management typically involve measuring the height, diameter and relative position of trees using equipment such as tape measures, ultrasound instruments, total stations and terrestrial laser scanners. However, there are limitations to these methods – they’re often time consuming, involve multiple setups and numerous members of staff to take the measurements (especially since forestry is usually in remote and difficult to access areas). Due to dense canopy cover, forests are usually GNSS-denied areas, and along with the uneven terrain, it can be difficult and time consuming to measure with terrestrial laser scanners.
Geocentar have a large client base in the forestry industry and upon delivery of our new ZEB Horizon mobile laser scanner, we decided to put the technology through its paces and see how it weighs up against other solutions for measuring biomass.
“The ZEB Horizon captures forestry data more accurately than traditional methods and eight times faster“
Visiting the Perivoj Zrinskih park, the ZEB Horizon was initialised on a flat surface before the operator navigated around the park at normal walking pace. With a capture range of 100m, It took just 9 minutes in total to walk around the park and capture all the trees.
Back in the office we processed the data with GeoSLAM Hub software, then exported using GeoSLAM Draw. The data was then imported into an open source forestry programme called 3DForest whereupon several parameters could be measured and extracted automatically including ground extraction, tree detection, tree position detection, tree radius determination, tree height determination, tree crowns detection, crowns volume calculation and crowns collision determination.
Later we revisited the park to check the accuracy of their results and re-produced the survey using a total station with built-in REM (Remote Elevation Measurement) and a measuring tape. Not only did it take four minutes per tree to capture data due to all the total station setups, but only four parameters (diameter, height and relative position) could be calculated using these methods. If they had attempted to measure all 217 trees, it would have taken a whopping 14.5 hours!
Using the ZEB Horizon and 3DForest software, it took 9 minutes to scan the park, 12 to process the data in GeoSLAM Hub, 5 minutes to reduce the data size in Hub and prepare the cloud for the forestry software, which took 90 minutes to process. The total workflow took just under two hours to collect and measure all 217 trees – using traditional methods they could have surveyed just 29 trees in this time.
Geocentar calculated that results were accurate to within 3cm and were more accurate than using traditional methods, leading to great cost savings.

Industry
Conservation
Scan time
10 mins per
scan
Location
Cornwall,
UK
Size
1km in
length
Scanned
Eden Project
University of Leicester | Eden Project
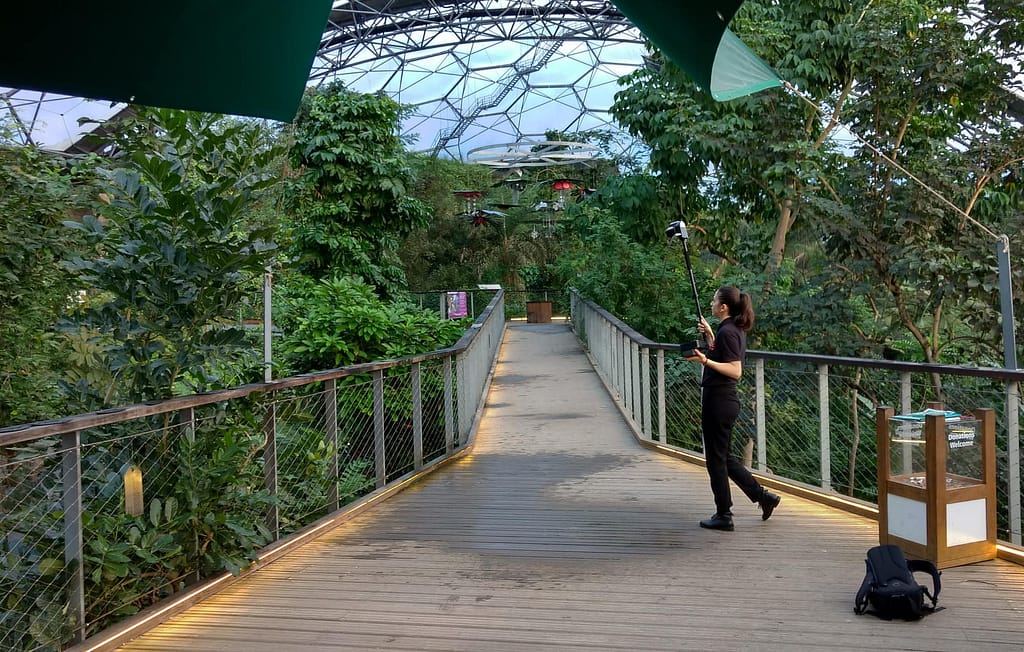
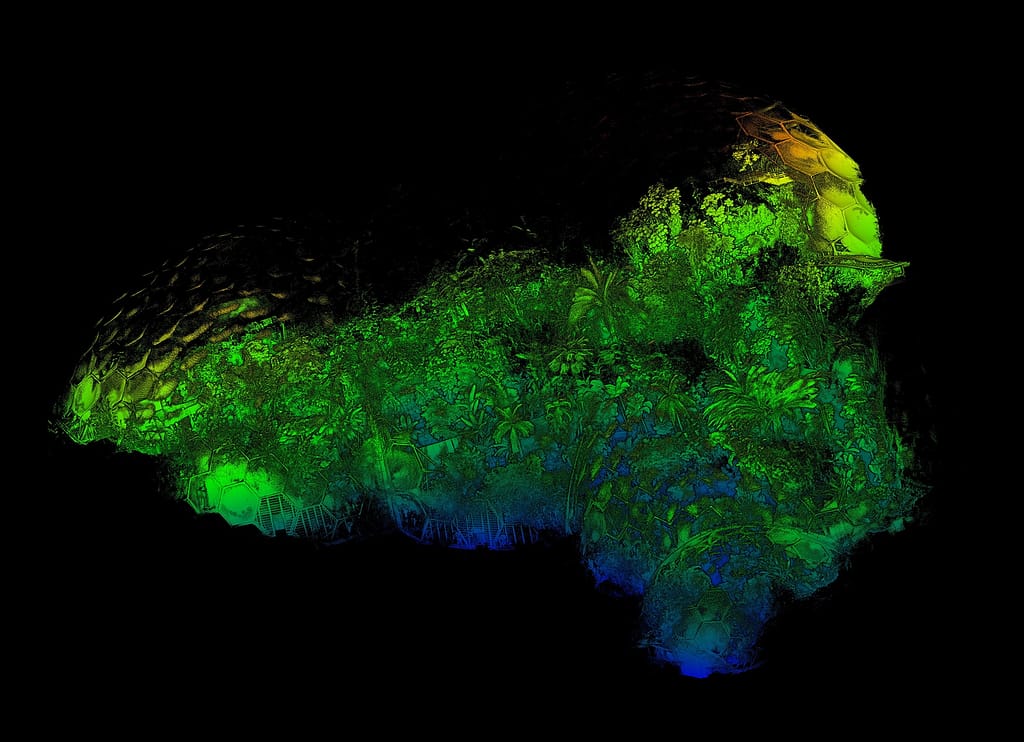
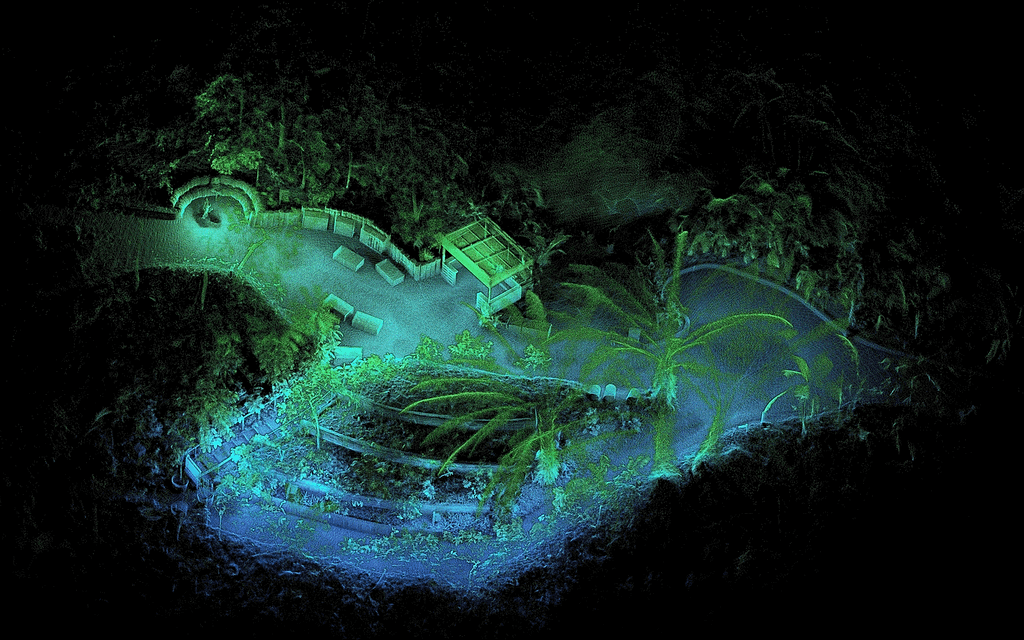
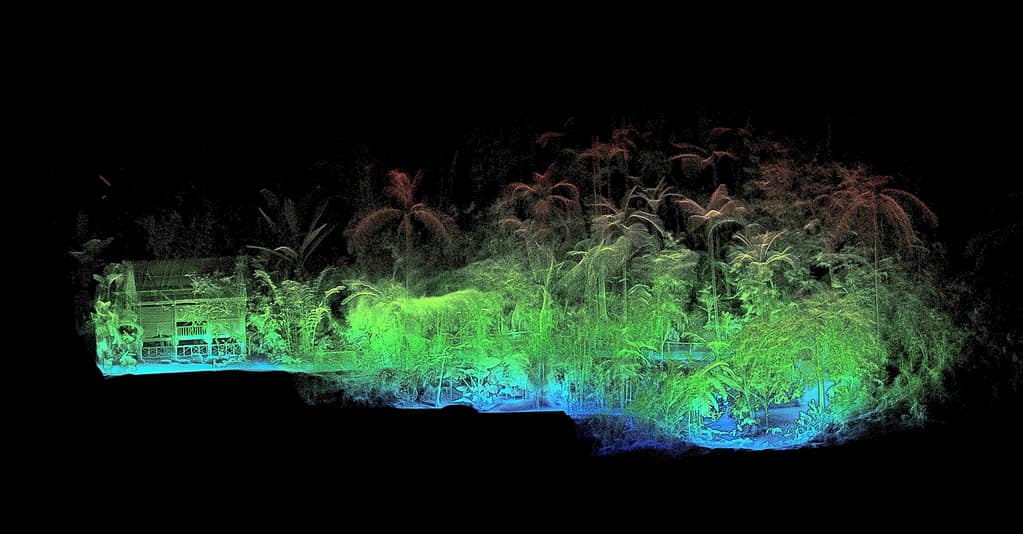
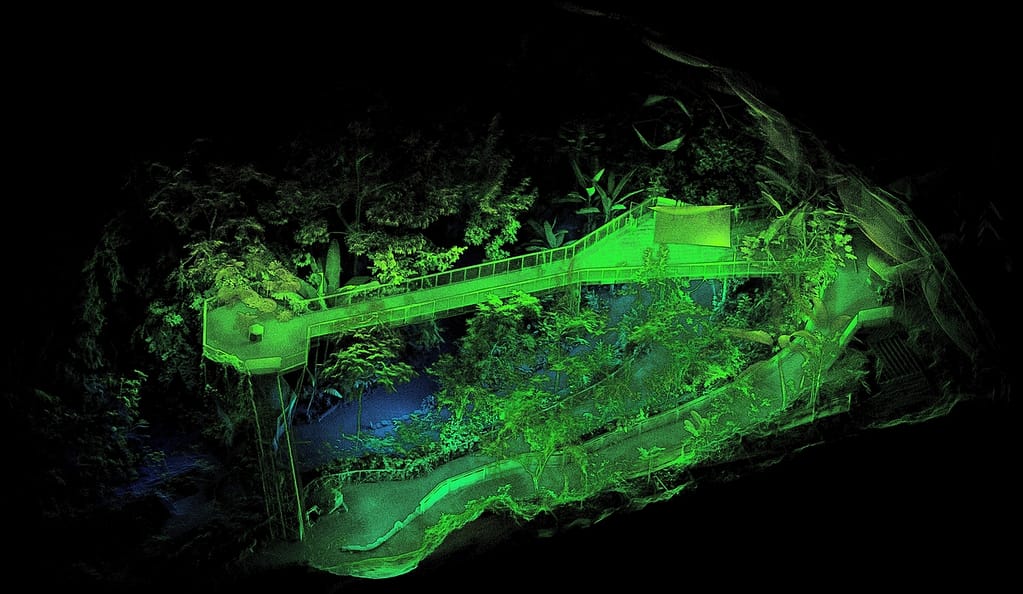
Monitoring and understanding our environment has never been more important as the threat of climate change looms and governments step up to better manage their greenhouse gas emissions. Tom Potter, a doctoral researcher at the University of Leicester, UK, set out to further develop a technique to estimate biomass and carbon more efficiently using state-of-the-art, mobile LiDAR sensors across multiple, complex forest environments.
To do so he visited the Eden Project in Cornwall, UK which reflects a true tropical forest – representing different forests from around the world with a rainforest ‘biome’ of over 1,000 tropical trees and plans. However, he had to work around several challenges. For fixed point scanners, the high-density plots of specimens created a problem of shadows – known as ‘occlusions’ – whereby the nearest features will block out features behind. This also limits the ability to acquire accurate measurements to create a comprehensive 3D model. And with the biome being open to the public and a popular tourist destination, Tom only had a few hours each day before opening hours – insufficient time for a traditional static survey.
“Using GeoSLAM’s local processing software, the raw scan data was processed on site, with no internet connection required – useful when in an actual rainforest!“
Mobile surveying equipment that was able to take readings easily and quickly from even the densest areas was needed to ensure precise scans were taken to accurately calculate biomass and carbon storage potential.
Tom found the mobility and speed of GeoSLAM’s ZEB Revo to be the perfect solution. The lightweight scanner can be pole mounted, handheld or even attached to a vehicle or drone – collecting over 43,000 measurement points per second. Instead of hundreds of time-consuming static scans, Tom captured all angles by simply walking in a loop around the rainforest environment.
He then converted the point cloud data into 3D volume-based plots to derive above-ground biomass and carbon densities for multiple types of tropical forest. A comprehensive dataset was built, containing information for any type of forest that scientists can use to make calculations with minimal survey effort or expertise. And all at considerably less expenditure than traditional survey methods.
Location: United Kingdom
ZEB Scanner: ZEB Horizon
Scan time: 20 Minutes
This data was captured using GeoSLAM’s UAV mount on a DJI drone.
Would you like to see a specific dataset that’s not on this page? Contact [email protected]

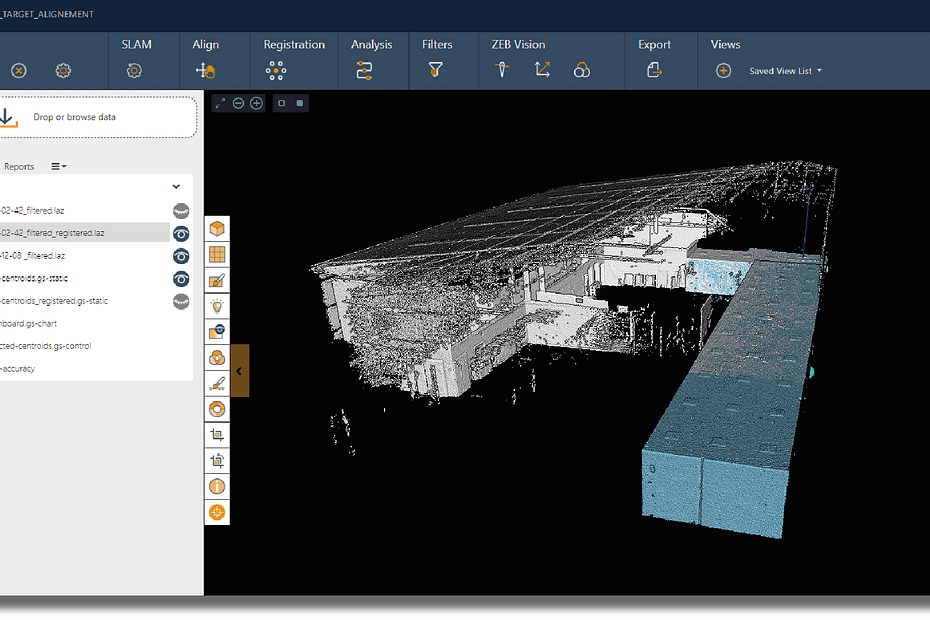
Known control points are captured during a scan and automatically compared and matched to the associated coordinates during the processing stage in Connect. A rigid and/or a non-rigid adjustment can be made to the dataset and an accuracy report is exported, highlighting how successful the transformation was. Users can now view and manipulate the processing parameters to ensure a more accurate match between points.
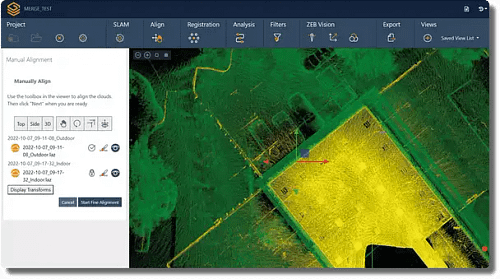
Align multiple scans using a combination of manual and automatic processes. This workflow can be performed on two or more scans in the same project. Users have a choice to export the aligned scans separately or as a single merged point cloud.

Common data capture scenarios, such as UAV, outdoor, indoor, linear, and vehicle, have been characterised in Connect and data processing pre-sets for each environment have been defined. These can be selected at the beginning of the data processing stage allowing this process to be highly simplified.

Both methods match the scan data from a ZEB Locate system with the GPS data collected from the antenna to georeference the point cloud. When a scan starts and ends in the same place, this is classed as “closed loop”. “Open loop” is when the start and end position of a scan are in different locations. Standard SLAM practices apply to both methods of data collection.
Open Loop SLAM for the ZEB Locate is available on request – let’s talk about it.

Common static points are captured during several scans meaning that these datasets can be automatically aligned. A single point cloud is then exported as if the data was captured in a single scan.
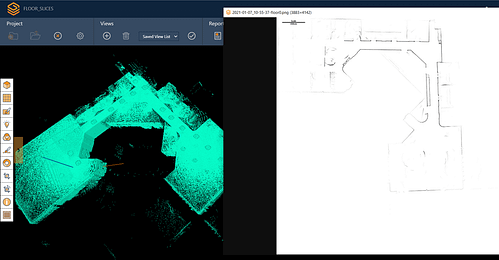
Horizontal and vertical slices can be taken from any location within the point cloud. Horizontal floor slices can also be automatically taken at a given height above the floor as defined in the processing stage.
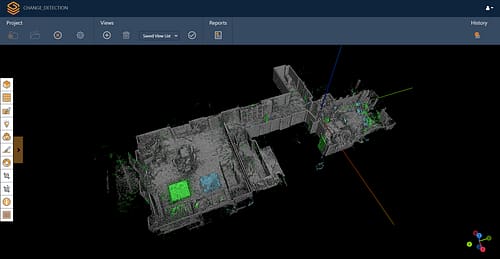
Mostly used in the construction industry, multiple point clouds can be compared and any areas that have changed are automatically highlighted. Point clouds can also be compared with CAD models – for instance to track progress on a construction site – and PDF reports can be generated to present this information.


Some SLAM software algorithms have been made available as open-source on the internet, but they are purely algorithms and not a product that you can take and use off-the-shelf. SLAM is most successful when it is tightly coupled and designed with specific hardware in mind. A generic SLAM cannot perform as well as one that has been specifically designed for a purpose.

Visual SLAM is closer to the way humans navigate the world, which is why it’s popular with robotic navigation. But in the same vein, vSLAM will have the same image-capture challenges as humans do, for example not being able to look into direct sunlight, or not having enough contrast between the objects picked up in the image. These can be overcome indoors, however, you may need to map a forest, tunnel or urban canyon. While SLAM technologies don’t rely on remote data (meaning you can scan areas where there is no GPS), you do need to ensure the SLAM technology you chose operate well inside, outside, in daylight and darkness.
Mapping a property is time-critical. Ideally, you want to make a single visit and gather sufficient data to create a highly accurate 3D model. Ensure the software you choose transforms 3D point cloud data into actionable information in real-time. This allows you to view and interrogate your data whilst still in the field, and make any adjustments, or collect missed data, then and there.

If you’re trying to map an enclosed environment (e.g. tunnel, mine) or a complex, difficult-to-access space such as a heritage building with tight stairwells and uneven floors, you need to use fully-mobile, adaptable technology. Wheel-based systems, often used with the vSLAM camera, will struggle with access. Handheld devices or LiDAR scanners that can be attached to a drone or pole and still deliver accurate results in a rugged environment are best for navigating hazardous spaces.

While vSLAM is able to provide a qualitative high-level map and sense of the surrounding features, if you’re needing survey-quality accuracy and rich-feature tracking at a local level, you’ll need to consider LiDAR. Cameras require a high-frame-rate and high processing to reconcile data sources and a potential error in visual SLAM is reprojection error, which is the difference between the perceived location of each setpoint
and the actual setpoint.

In order to deliver the depth required for high-quality data, a number of depth-sensing cameras are needed with a strong field of view. In most cases, this isn’t possible, especially as cameras with high processing capabilities typically require larger batteries which weigh down airborne scanners, or limit the time of flight. LiDAR is both faster and more accurate than vSLAM, and can deliver detailed point clouds without expensive (and timely) camera processing.