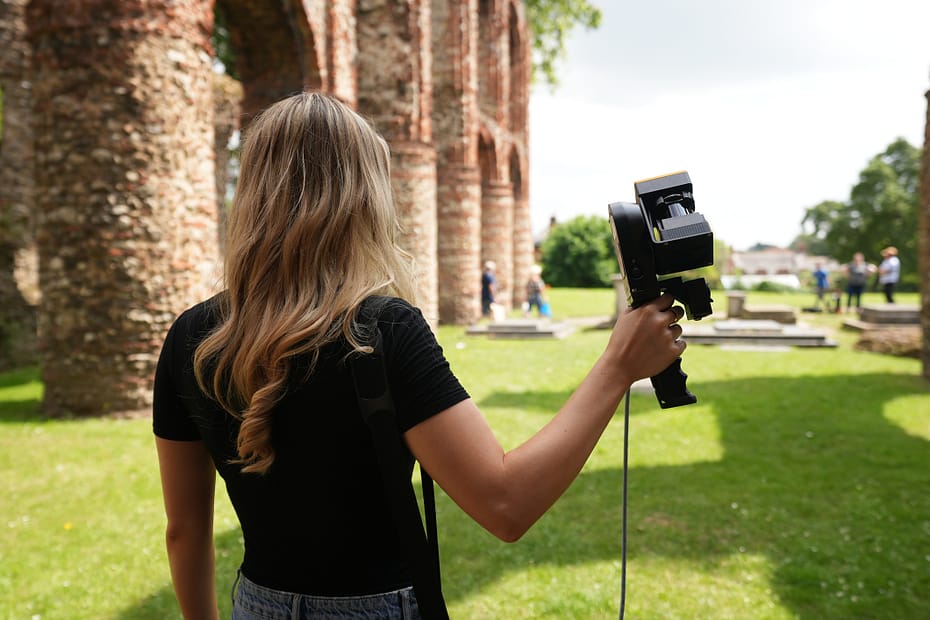
How Can We Use Laser Scanning For Historic Preservation?
Last Updated on 25th April 2022 How can we use laser scanning… Read More »How Can We Use Laser Scanning For Historic Preservation?
Last Updated on 25th April 2022 How can we use laser scanning… Read More »How Can We Use Laser Scanning For Historic Preservation?
Location: United Kingdom
ZEB Scanner: ZEB Horizon
Scan time: 45 Minutes
Would you like to see a specific dataset that’s not on this page? Contact [email protected]
Last Updated on 25th April 2022 Why is Geospatial Information so Important?… Read More »Why is Geospatial Information so Important?
Location: California, USA
ZEB Scanner: ZEB Horizon
Scan time: 6 Minutes
This data was captured with the ZEB Horizon mounted to a vehicle using our car mount.
Would you like to see a specific dataset that’s not on this page? Contact [email protected]
Location: Ornolac-Ussat-les-Bains, France
ZEB Scanner: ZEB Horizon
The scan was taken as part of Deep Time 40 project – Click here to learn more about this project
Would you like to see a specific dataset that’s not on this page? Contact [email protected]
Location: London, United Kingdom
ZEB Scanner: ZEB Horizon
Scan time: 5 Minutes
This data was captured as part of the Big SLAM Tour of the UK, read about it here.
Would you like to see a specific dataset that’s not on this page? Contact [email protected]
Location: Nottingham, UK
ZEB Scanner: ZEB Horizon/ ZEB Discovery
Scan time: 15 Minutes
Colourised data was captured using the ZEB Discovery backpack solution.
Would you like to see a specific dataset that’s not on this page? Contact [email protected]

Otrobanda,
Curaçao

St. Elisabeth
Hospital

22,346
Square Meters

20 minutes
per scan

Surveying
St. Elisabeth Hospital | Providing healthcare to a Caribbean Island
Constructed in 1855, with the help of the Franciscan sisters, the St. Elisabeth hospital has played an important role in the Otrobanda City district on the Caribbean island of Curaçao, for over 160 years. The large hospital served as the main hub for medical care, and was historically used as a place of healing for other island nations nearby.
Having been deemed no longer fit for purpose according to international standards in 2011, it was decided that a new hospital would be constructed next to St Elisabeth’s, and in 2019 the Curaçao medical center was opened to the public. St. Elisabeth hospital was closed in November 2019, after 164 years of service to the island.
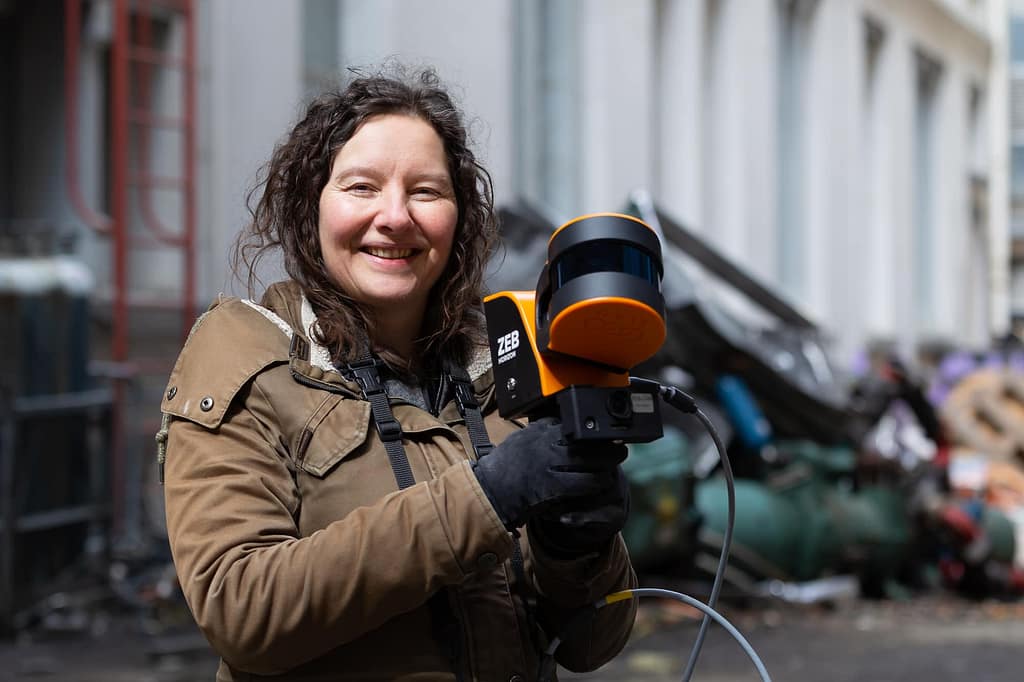
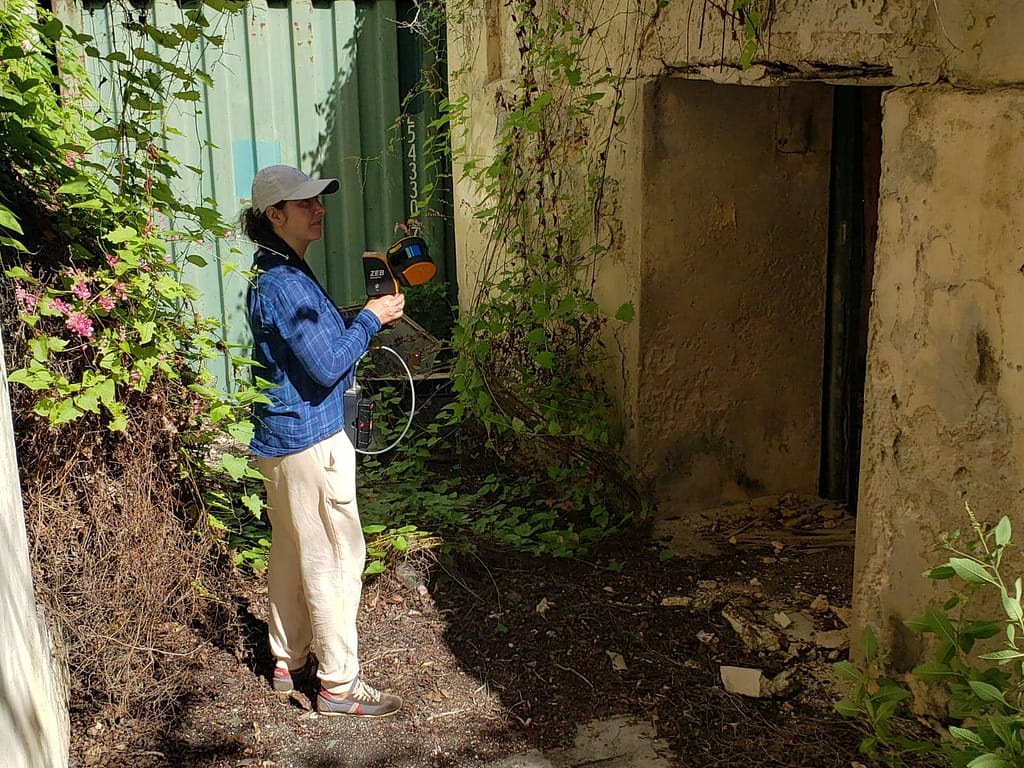
In 2021, Ellen de Brabander, from Urban Studio, was appointed by the survey bureau ‘Landmark’ with the task of scanning the hospital, in anticipation of renovation projects. Ellen chose the ZEB Horizon for the task, and later created an accurate BIM model using the point cloud data. In addition, Ellen is working on creating a virtual tour of the hospital, so it can be entered and explored from anywhere in the world.
Scanning with the ZEB Horizon
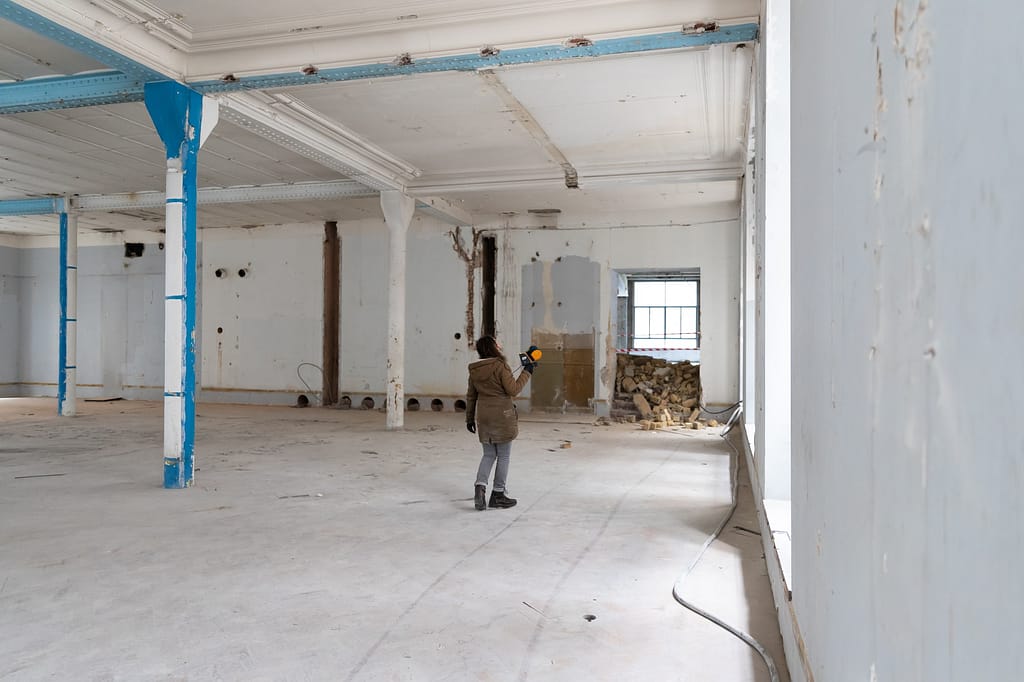
Due to the large complex nature of the building, with several floors and many individual rooms, the task of capturing and measuring the hospital was an enormous one, in terms of time frame. Originally Ellen was going to scan the building using a total station, however because the hospital is broken into 6 sub-buildings, an average of 3 floors per sub-building and many individual rooms per floor, the total station was quickly ruled out. Furthermore, with difficult to access areas, the bulky nature of a tripod-based system would not be ideal for capturing the hospital in its entirety, or fast enough.
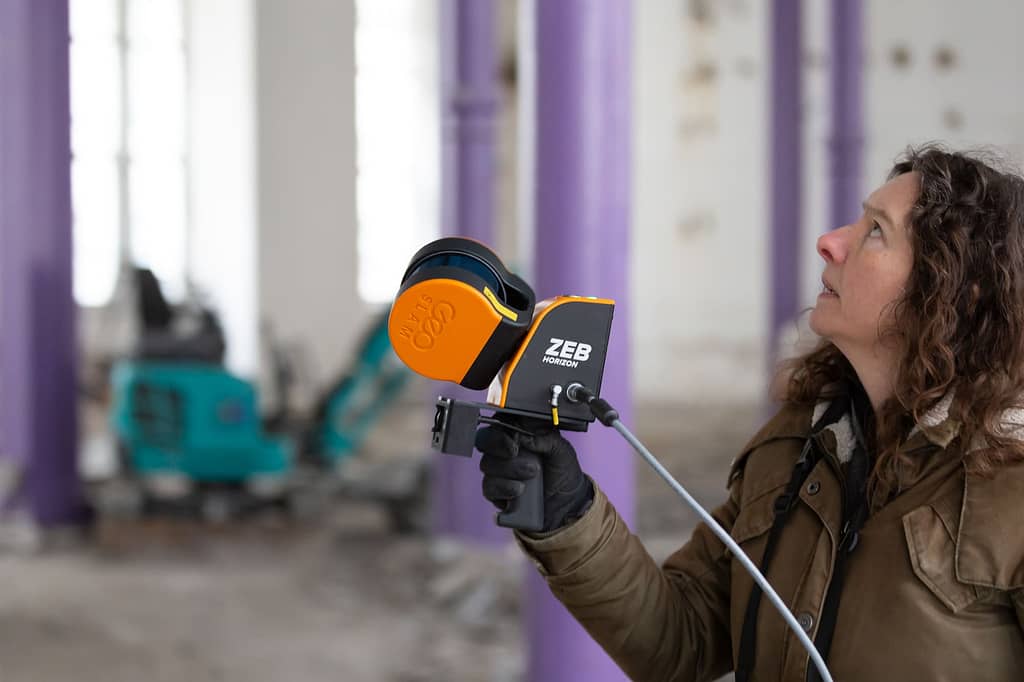
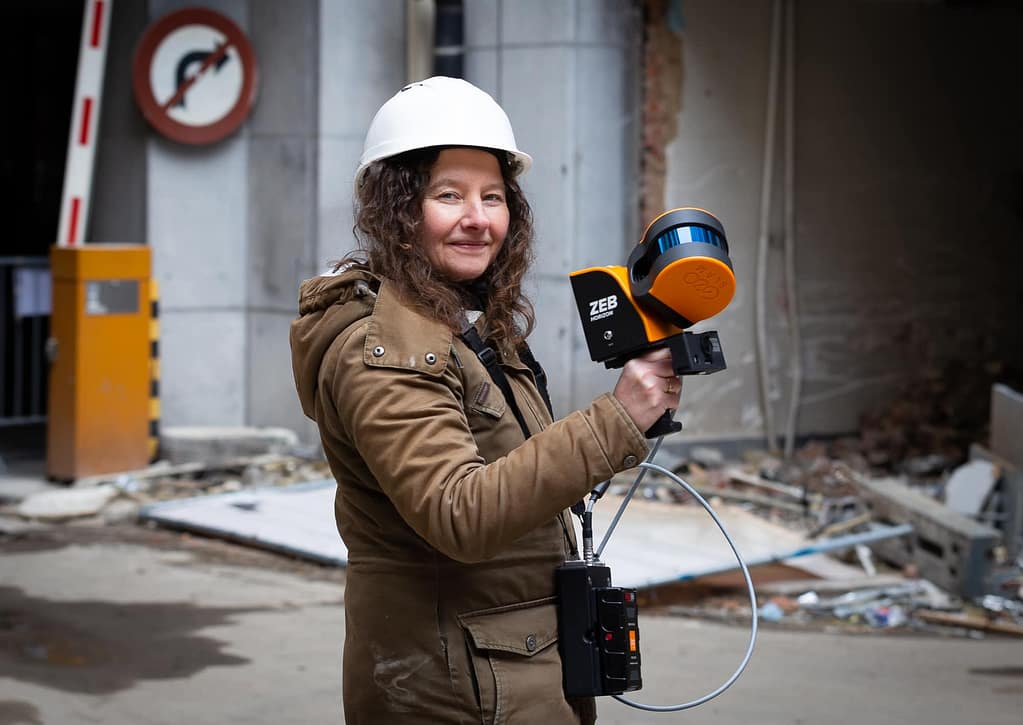
After assessing the options, the team decided the best way to capture the building would be to use a mobile 3D scanner, due to the lightweight nature, speed of capture and ease of use. Ellen chose a ZEB Horizon for the job and was able to seamlessly walk through the hospital’s complex buildings, capturing data as she moved.
The 3D scanner of GeoSLAM was able to reduce the time of the measurement and as a result the delivery time was met. The measurement time would normally take several months, which was reduced to days
Having decided on the ZEB Horizon, she was able to capture both the interior and exterior of St Elisabeth’s hospital in just 6 full working days, which was an extremely short amount of time compared to traditional measuring equipment. 52 scans were conducted in total, at approximately 20 minutes per scan and the area covered (including exterior and interior) was 22,346 square meters. The complex nature of some of the spaces were captured effortlessly because of the manoeuvrability and compactness of the scanner.
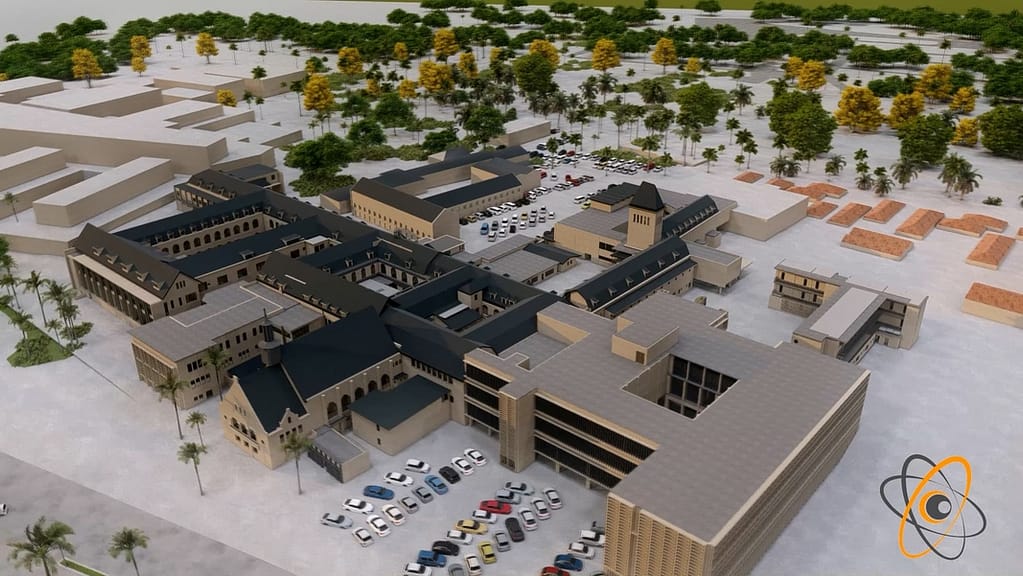
Post scan
The scans were processed and merged using GeoSLAM Hub before they were converted in Autodesk Recap and taken into Autodesk Revit to be modelled. The model of the hospital was sent to the client and the process from capture to model was documented in a video, which can be seen here:
If you’d like to learn more about how GeoSLAM solutions can help you, submit the form below.
Location: Essex, UK
ZEB Scanner: ZEB Revo RT
Scan time: 20 Minutes
This data was captured as part of GeoSLAM’s Big SLAM Tour in 2021. Click here to learn more about the scan
Would you like to see a specific dataset that’s not on this page? Contact [email protected]
Location: Europe
ZEB Scanner: ZEB Revo RT
Scan time: 20 Minutes
GeoSLAM’s ZEB Pano was used to capture images of the distillery.
Would you like to see a specific dataset that’s not on this page? Contact [email protected]
Location: London, United Kingdom
ZEB Scanner: ZEB Horizon
Scan time: 5 Minutes
This data was georeferenced with the ZEB Locate accessory and captured as part of the Big SLAM Tour of the UK, read about it here.
Would you like to see a specific dataset that’s not on this page? Contact [email protected]
Location: Europe
ZEB Scanner: ZEB Horizon
Scan time: 20 Minutes
Would you like to see a specific dataset that’s not on this page? Contact [email protected]

Known control points are captured during a scan and automatically compared and matched to the associated coordinates during the processing stage in Connect. A rigid and/or a non-rigid adjustment can be made to the dataset and an accuracy report is exported, highlighting how successful the transformation was. Users can now view and manipulate the processing parameters to ensure a more accurate match between points.
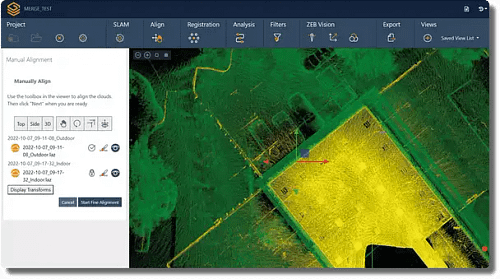
Align multiple scans using a combination of manual and automatic processes. This workflow can be performed on two or more scans in the same project. Users have a choice to export the aligned scans separately or as a single merged point cloud.

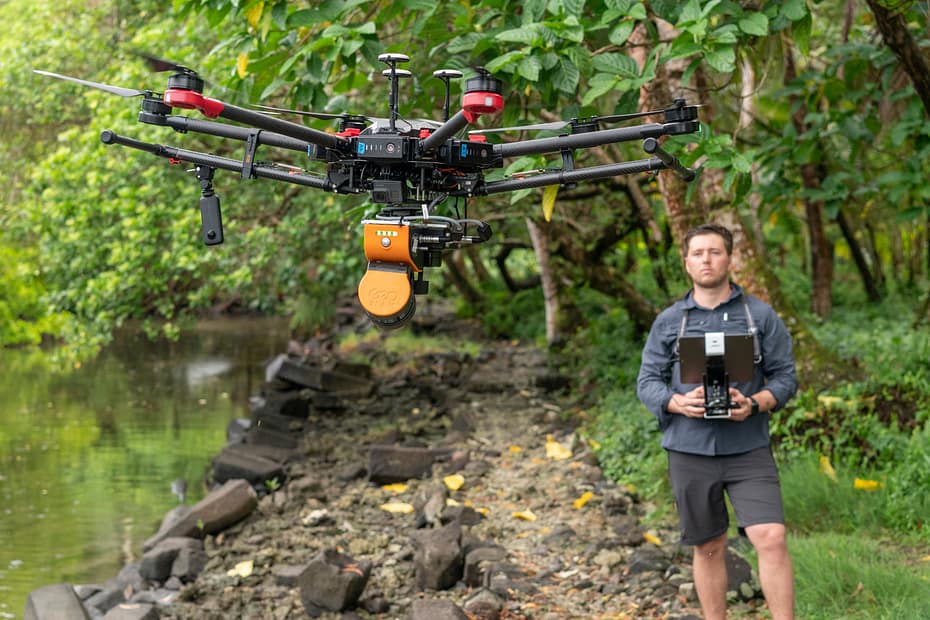
Common data capture scenarios, such as UAV, outdoor, indoor, linear, and vehicle, have been characterised in Connect and data processing pre-sets for each environment have been defined. These can be selected at the beginning of the data processing stage allowing this process to be highly simplified.

Both methods match the scan data from a ZEB Locate system with the GPS data collected from the antenna to georeference the point cloud. When a scan starts and ends in the same place, this is classed as “closed loop”. “Open loop” is when the start and end position of a scan are in different locations. Standard SLAM practices apply to both methods of data collection.
Open Loop SLAM for the ZEB Locate is available on request – let’s talk about it.

Common static points are captured during several scans meaning that these datasets can be automatically aligned. A single point cloud is then exported as if the data was captured in a single scan.
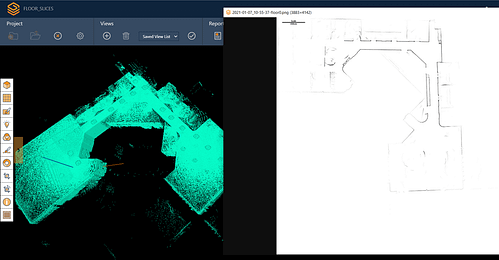
Horizontal and vertical slices can be taken from any location within the point cloud. Horizontal floor slices can also be automatically taken at a given height above the floor as defined in the processing stage.
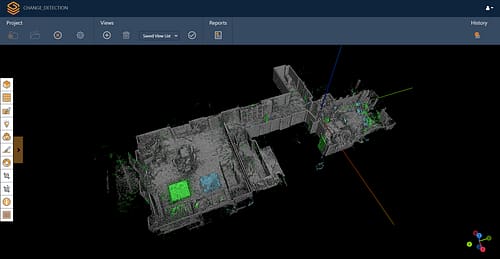
Mostly used in the construction industry, multiple point clouds can be compared and any areas that have changed are automatically highlighted. Point clouds can also be compared with CAD models – for instance to track progress on a construction site – and PDF reports can be generated to present this information.


Some SLAM software algorithms have been made available as open-source on the internet, but they are purely algorithms and not a product that you can take and use off-the-shelf. SLAM is most successful when it is tightly coupled and designed with specific hardware in mind. A generic SLAM cannot perform as well as one that has been specifically designed for a purpose.

Visual SLAM is closer to the way humans navigate the world, which is why it’s popular with robotic navigation. But in the same vein, vSLAM will have the same image-capture challenges as humans do, for example not being able to look into direct sunlight, or not having enough contrast between the objects picked up in the image. These can be overcome indoors, however, you may need to map a forest, tunnel or urban canyon. While SLAM technologies don’t rely on remote data (meaning you can scan areas where there is no GPS), you do need to ensure the SLAM technology you chose operate well inside, outside, in daylight and darkness.

Mapping a property is time-critical. Ideally, you want to make a single visit and gather sufficient data to create a highly accurate 3D model. Ensure the software you choose transforms 3D point cloud data into actionable information in real-time. This allows you to view and interrogate your data whilst still in the field, and make any adjustments, or collect missed data, then and there.

If you’re trying to map an enclosed environment (e.g. tunnel, mine) or a complex, difficult-to-access space such as a heritage building with tight stairwells and uneven floors, you need to use fully-mobile, adaptable technology. Wheel-based systems, often used with the vSLAM camera, will struggle with access. Handheld devices or LiDAR scanners that can be attached to a drone or pole and still deliver accurate results in a rugged environment are best for navigating hazardous spaces.

While vSLAM is able to provide a qualitative high-level map and sense of the surrounding features, if you’re needing survey-quality accuracy and rich-feature tracking at a local level, you’ll need to consider LiDAR. Cameras require a high-frame-rate and high processing to reconcile data sources and a potential error in visual SLAM is reprojection error, which is the difference between the perceived location of each setpoint
and the actual setpoint.

In order to deliver the depth required for high-quality data, a number of depth-sensing cameras are needed with a strong field of view. In most cases, this isn’t possible, especially as cameras with high processing capabilities typically require larger batteries which weigh down airborne scanners, or limit the time of flight. LiDAR is both faster and more accurate than vSLAM, and can deliver detailed point clouds without expensive (and timely) camera processing.