The role of LiDAR plays in convergence analysis
Last Updated on 11th May 2023 The role LiDAR plays in convergence… Read More »The role of LiDAR plays in convergence analysis
Last Updated on 11th May 2023 The role LiDAR plays in convergence… Read More »The role of LiDAR plays in convergence analysis
Location: Turkey
ZEB Scanner: ZEB Horizon
Would you like to see a specific dataset that’s not on this page? Contact [email protected]
Last Updated on 30th March 2023 What part does LiDAR play in… Read More »What part does LiDAR play in the Disaster Management Cycle ?
Last Updated on 17th April 2023 The relationship between LiDAR, SLAM and… Read More »The relationship between LiDAR, SLAM and Mining
Location: United Kingdom
ZEB Scanner: ZEB Revo RT
This data was captured using GeoSLAM’s ZEB Cradle accessory.
Would you like to see a specific dataset that’s not on this page? Contact [email protected]
Boulby mine was one of the first in the world to use SLAM technology, having adopted GeoSLAM’s ZEB1 into their workflow, in 2013. Nowadays, the mine operates GeoSLAM ZEB Horizons for most of their survey needs.
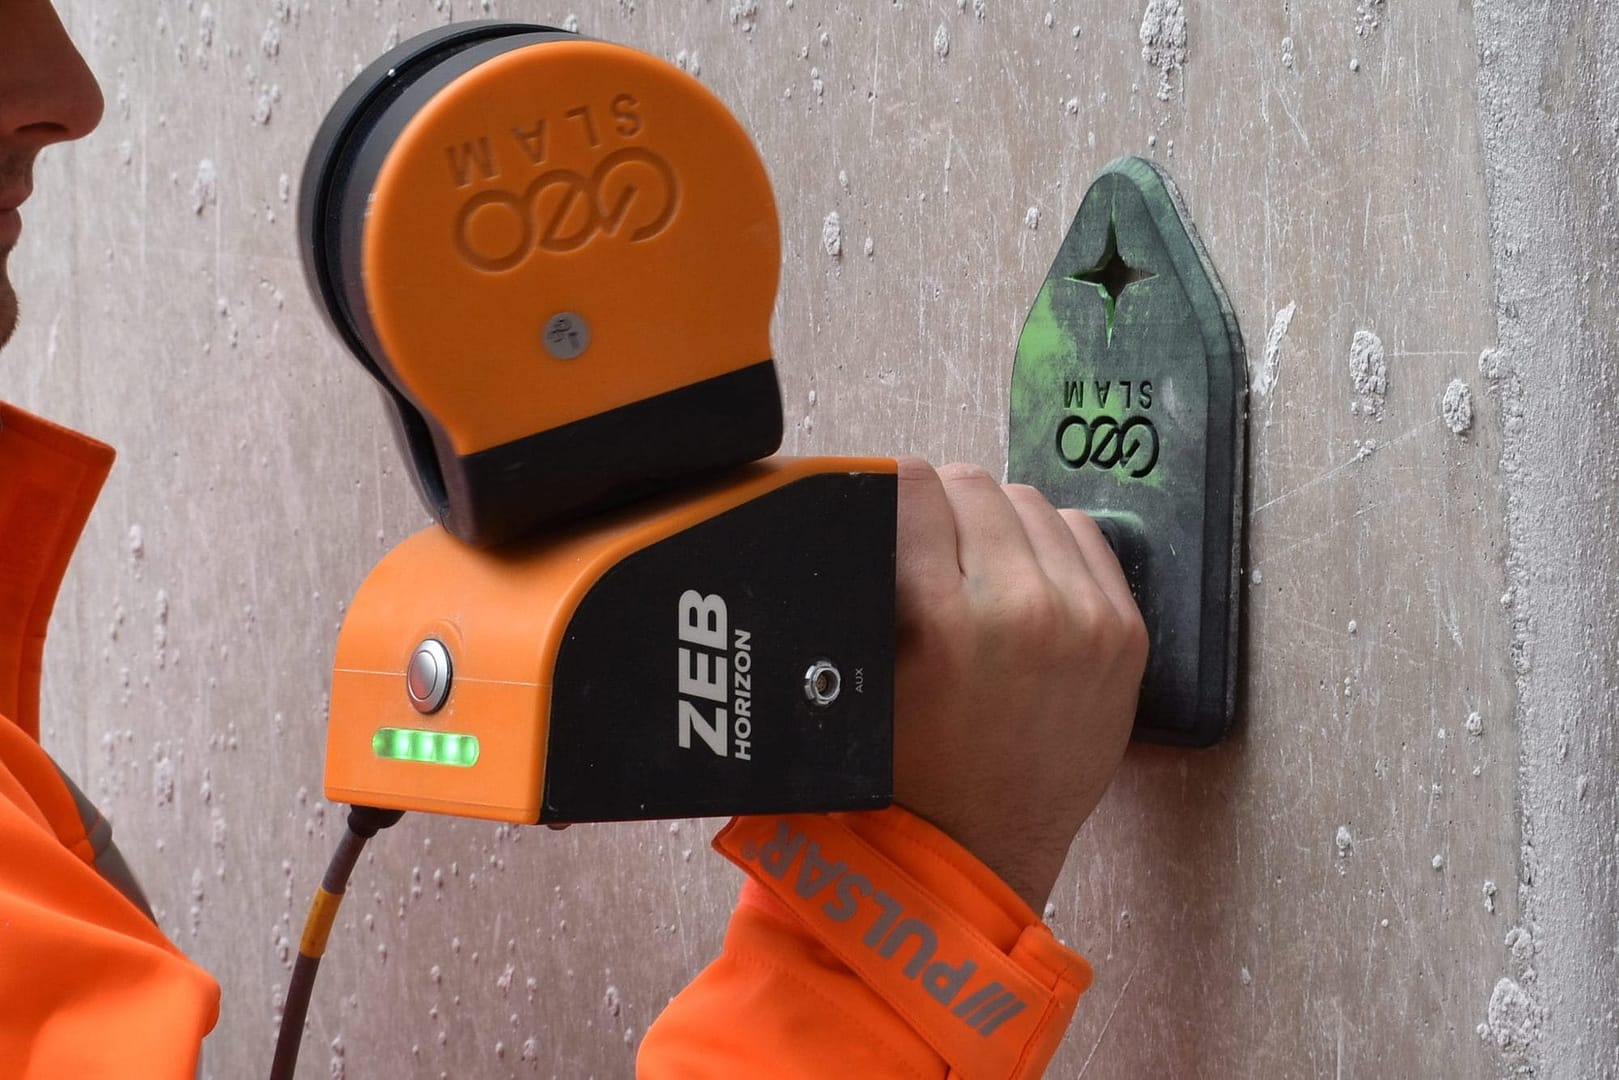
Control points are points within a given area that have known coordinates. They are a key tool in the geospatial industry and can be utilised in a variety of ways, including georeferencing point clouds and aligning aerial images to terrestrial data. By using control points, surveyors are able to accurately map larger areas and position overlapping surveys of an area together. They can also be used in non-geospatial industries, such as construction and mining, to show clear temporal comparisons between multiple surveys of the same area. This method of georeferencing is also referred to as adjust to control.
Previously, checkerboards and spherical targets have been used as control markers – these items are captured in surveys and can be identified for georeferencing or aligning. The main drawback with these methods is that they rely heavily on human interpretation when processing, meaning that the processed datasets may be susceptible to an increased amount of error.
When capturing handheld surveys, GeoSLAM systems are able to collect reference points. These can then be matched with known control points to reference scans and increase the level of accuracy.

Easily reference point clouds and produce reports highlighting accuracy values.

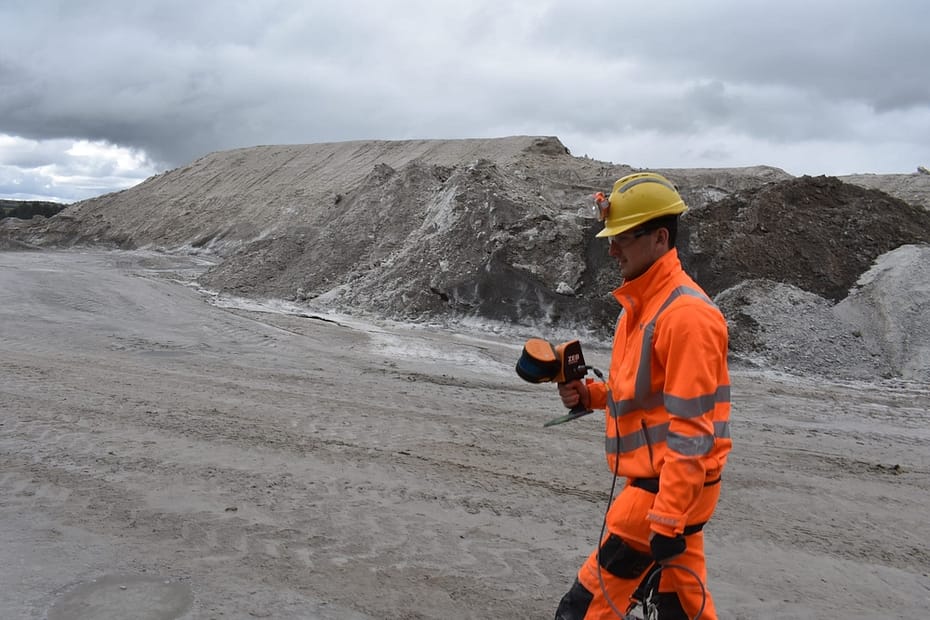
Regularly monitor site operations (e.g. stockpiles) and hazards.

Compare changes over time and map progress onto predetermined CAD/BIM models.
Once georeferenced using control points, point clouds can be optimised further using leading third party software:
For more information about our third party partnerships, head to our integrations page.
Beck Engineering, an Australian mining engineering consultancy specialising in mining and rock mechanics analysis, needs to rapidly map mines under intense time constraints using versatile technology which is adaptable to any environment. GeoSLAM’s handheld mobile mapping solution was chosen as it is compact, portable and delivers a high level of accuracy. With GeoSLAM’s “go-anywhere” 3D technology in hand, Beck Engineering has been able to supply invaluable data regarding the direct effects of mining to better understand the implications of a deforming rock mass. Beck Engineering is now able to accurately measure the shape of an excavation or tunnel over time. As a result, tunnels are safer, better designed and more cost efficient.
We have continued to use GeoSLAM products as they have proven to be affordable, lightweight and sufficiently robust devices for their application underground. GeoSLAM continues to produce a high-quality device that is at the forefront of practical mobile laser scanning devices.
– Evan Jones, Senior Rock Mechanics Engineer at Beck
Keep up to date with the latest news and thought leadership from GeoSLAM.
With increasing awareness of LiDAR technology, its applications are becoming more diverse….
Popular Nottingham bar as you’ve never seen it before A historic chapel,…
Using 3D laser scanning to map difficult environments The advances in handheld…
Last Updated on 25th April 2022 Why is Geospatial Information so Important?… Read More »Why is Geospatial Information so Important?
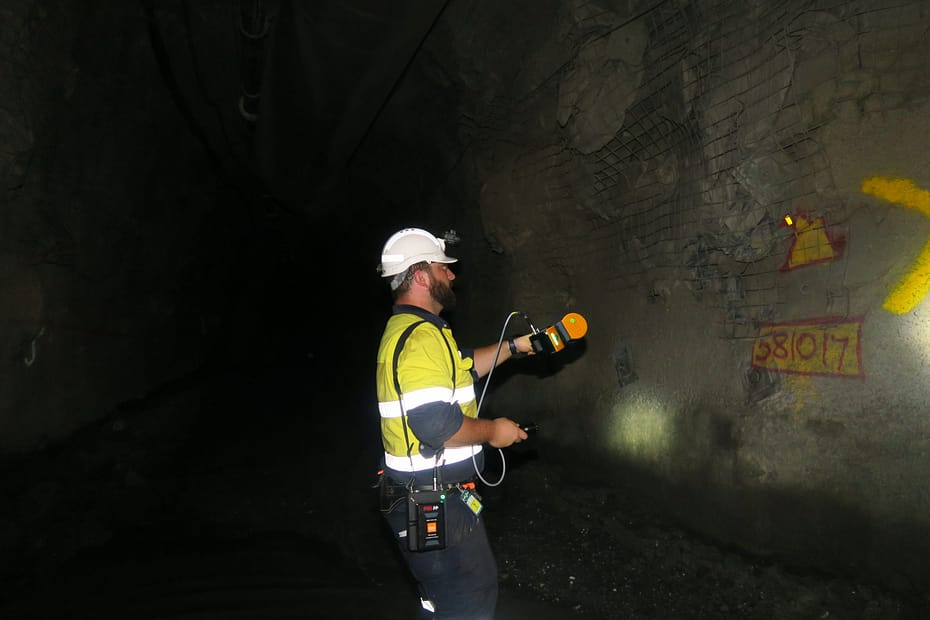
With the recent introduction and constant evolution of handheld SLAM (Simultaneous Localization and Mapping) scanning, mapping underground has become safer, quicker, more automated, highly repeatable, and more effective.

Hattorf/Wintershall
Facility, Germany

Cavity

70m Deep

N/A

Mining
Laserscanning Europe | German Dealer
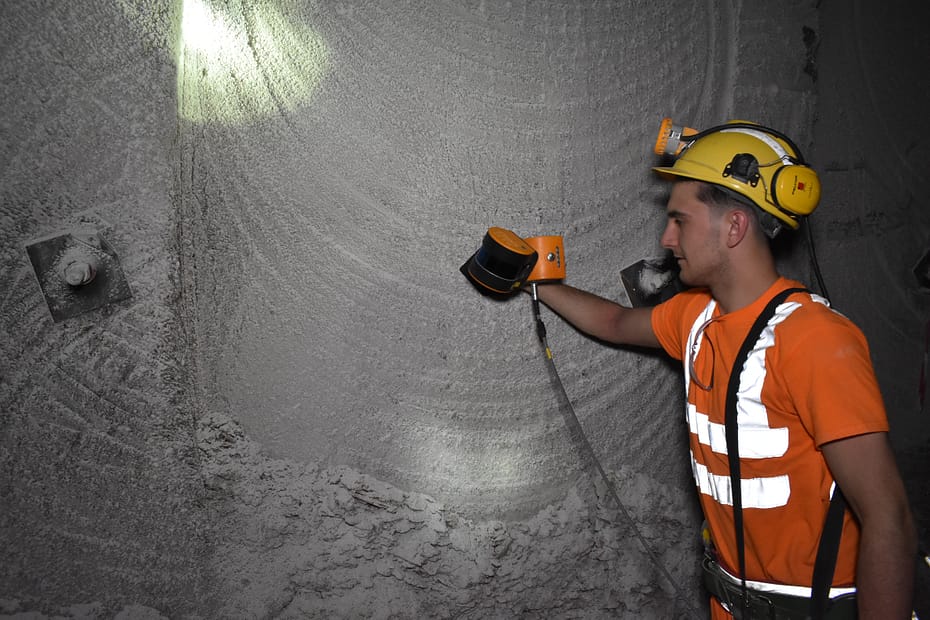
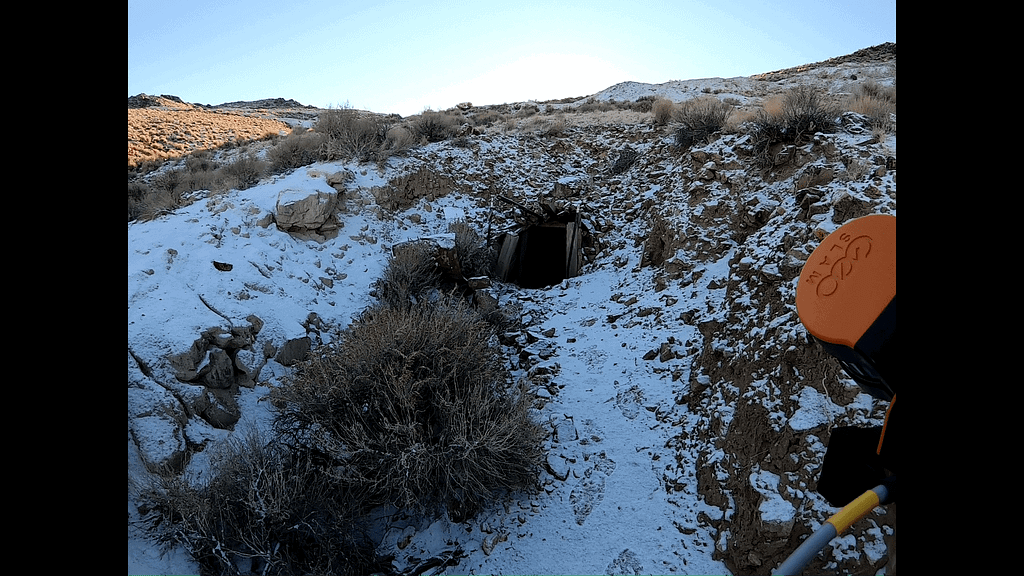
GeoSLAMs German dealer, Laserscanning Europe, were recently tasked with scanning a 70m deep cavity in a mine 500m below the earths surface. Using the ZEB Horizon on a cradle, Laserscanning Europe were able to successfully and safely capture the data, and this is their account of the job.
Data captured by Laserscanning Europe
Scanning with the ZEB Horizon | Words by Laserscanning Europe
The object of measurement is located in the Hattorf/Wintershall mining facility of the company K+S Minerals and Agriculture GmbH. This is a cavity (underground, vertical conveyor system) about 500m below the earth’s surface with a depth of 70m.
The cavity no longer has the original storage volume due to material deposits from years of operation. The environment is dusty and it is expected that material will be deposited within the conveyor system at any time. In addition, the cavity is not accessible to humans from any opening and access is only possible through 1m diameter openings.
The objective was to obtain a three-dimensional survey of the conveyor system with highest possible resolution for inspection of the systems condition. Furthermore, strict compliance with all work safety regulations, with minimal risk for the measuring team, was required.
For this job, a mobile laser scanner was used. Thanks to its specifications, the GeoSLAM ZEB Horizon is ideally suited for the special conditions underground. The scanner is also suitable for surveying a cavity that is only accessible from above through a narrow shaft.
The scanner was mounted on a cradle, which was modified to minimise rotational movements when lowered. A 50m rope was attached to the cradle, which was used to lower the measurement system into the cavity.
Furthermore, trained members of the mine rescue team were on site to provide security and enable the scanner to be lowered and retrieved safely.
Workflow of the analysis
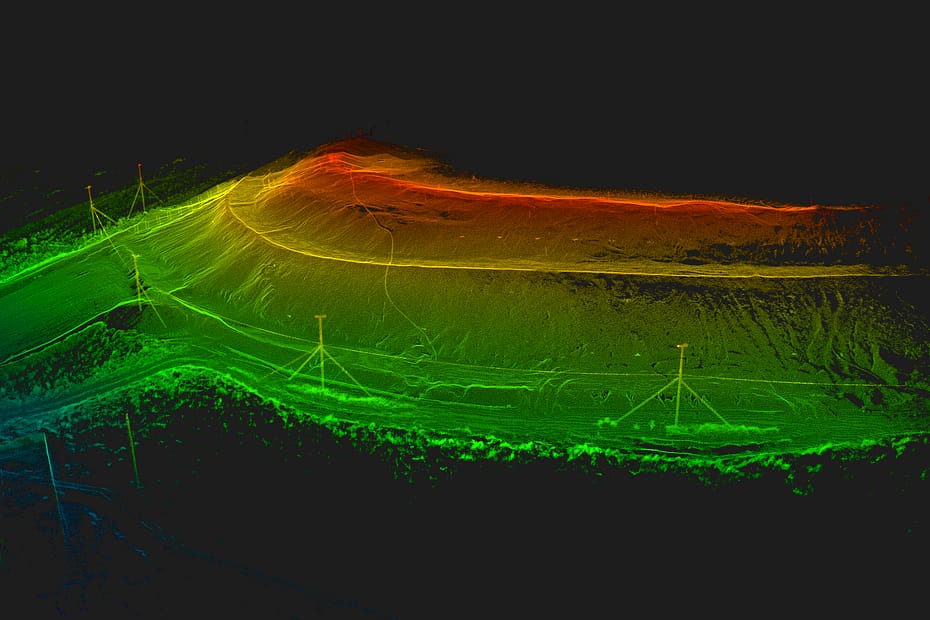
Following the survey, the scan data was processed using the GeoSLAM HUB software. The raw data, i.e. the processing of the point cloud from the data of the laser sensor and the IMU, is automated as much as possible. In the case that a scan was not automatically processed (e.g. because few geometric changes are found in the object space), the focus of the SLAM algorithm can be influenced by adjusting various parameters. Once the data has been run through GeoSLAM Hub, a complete point cloud of the cavity is available in .laz format. All other common point cloud formats can also be exported with little effort.
Since the scanner could only be lowered linearly on the rope, the earth deposits shadow smaller areas inside the cavity.
Results
The result of this scanning is impressive. This cavity, which is not accessible to humans, was successfully surveyed with the help of the GeoSLAM ZEB Horizon. The point cloud documents the dimensions of the cavity according to the requirements. Further missions with the GeoSLAM ZEB Horizon with similar objectives are already being planned and implemented.

The history of shotcrete
Since its conception in the early 1900s, shotcrete application has developed to become one of the most critical ground supporting techniques for underground excavations. The technology has evolved from manual nozzle handling to computer guided, hydraulically controlled boom-mounted nozzles. By controlling variables in the shotcreting application, the layer of sprayed concrete can be optimally designed to meet the in-situ geotechnical constraints. In some scenarios, shotcrete will be designed to flex with the squeezing rock, whilst in others, it may simply act as a barrier to protect from rock bursts.
Understanding how the shotcrete will react in different conditions allows operators to apply the right amount of material. Shotcrete thickness is paramount when applying shotcrete, therefore it must be monitored during application using the safest and most reliable method. The aim of this article is to demonstrate how the SR-50 system, developed by GeoSLAM, is suitable for near real-time shotcrete application quality assurance and quality control (QA/QC).
Shotcrete – The modern method with failing processes
The Sika Sprayed Concrete Handbook (1) states that the only method for accurately calculating initial strength is by measuring thickness. Current methods rely on operators endangering themselves to un-secured shotcrete in order to manually collect thickness readings. A total of 5% of all tunneling injuries can be attributed to the shotcreting process in tunneling (2). Industry professionals recognise the need to balance the provision of a safe working environment for its operators with the demand for increased production rates, accurately measured and documented shotcrete thickness.
In 2016 GeoSLAM developed the SR-50 system deployed throughout the Jetcrete Australia fleet. The technology has now been licensed to Normet Oy who have adopted the technology as SmartScan.
The system provides the operator with near real-time results displaying shotcrete thickness after each application cycle with a single button press. A colour-coded map of the spray area allows the operator to identify regions of concern easily and accurately. Once the operator is satisfied that the sprayed thickness complies to site criteria an electronic report is automatically created. This report documents the application cycle, providing the average applied thickness, total volume of shotcrete applied to the surface and the final thickness map that can be used for quality assurance. All data is stored on the system for further analysis and archiving. Without exposing the operator to dangerous conditions, the system can act as a training tool for novice operators, as well as aiding experienced operators to spray to the desired profile thickness, thus minimising overspray.
Analysis of data collected from sites using the SR-50, showed an approximate 20% reduction in overall concrete usage. This means that an average single sprayer operation can reach a return of investment within 2-3 months, have improved safety, and expedite the shotcrete application process.
The system created by GeoSLAM now achieves an accuracy of less than 5mm. This measured accuracy and reliability of measurement now enables the large-scale use of the technology on multiple sites.
The need to modernise
Traditional methods for measuring shotcrete thickness are based on invasive in-situ sampling at discrete points. Samples are taken either, when the shotcrete is freshly applied, e.g., Fibercrete Depth Indicators (FDI’s) or once the shotcrete has fully hardened, e.g. ASTM C174 drill core test. In both cases these methods have been shown to be unreliable and disruptive to the work cycle.
FDI’s are used by inserting “shotcrete stamps” into freshly applied shotcrete using the boom of the spraying rig. An investigation carried out at Olympic Dam in 2018 concluded that FDI’s were incredibly disruptive to the operation as well as poor measurement technique to represent the whole heading (3). For a typical profile heading with a cut length of 4.0m, the surface area sprayed was approximately 55m2. 20 probe sites were sampled, resulting in a sample area of approximately 0.05m2, or just 0.0009% of the sprayed surface.
Where drill core tests are taken most sites typically only manage to measure samples to the nearest 10mm, and again there is an element of bias towards where these drilled samples are taken from along the profile of worksite. Aside from an unsatisfactory sample size and potential for bias, the above methods either have the potential to damage the spray rig boom or are conducted hours after spraying, so any issues are not resolved at the time of application which result in time delays and extra costs.
There is an increasing trend in tenders and contracts throughout the shotcreting industry, requiring that shotcrete thickness be accurately measured and documented across the whole sprayed surface. Therefore, new, and novel methods must be used to meet the contractual obligations whilst minimising the disruption to the work cycle. The use of Laser Scanning technologies can meet these demands by providing non-invasive measurements at the time of application; sample points that can run in to the hundreds of thousands, overcoming sample bias; all taken in a handful of minutes immediately after the application meaning that any remedial action is taken immediately.
Laser Scanning: Accuracy benchmarks
Terrestrial Laser Scanners (TLS) and Scanning Total Stations (STS) systems are based on laser technology and are commonly used across numerous surveying sectors where accurate range measurements are required. Typical systems have accuracies that range from sub-mm to several mm’s depending on the underlying technology and cost. However, in the underground environment these technologies tend to be extremely expensive, complex to use, often requiring specialist training, and can require time-consuming processing in an office environment to produce results. The SR-50, although based on laser scanning technology was specifically designed for the shotcreting industry to be simple to use, automated, cost effective and accurate.
To evaluate the accuracy of the system a rigorous approach was developed. The assessment criteria relied on the use of a TLS (Riegl VZ-400) that was deployed in a controlled environment. The TLS was chosen on the premise that to assess the accuracy of the SR-50, the reference data must of greater accuracy than the test data. The ability to control any changes in the environment was paramount to avoiding ambiguities in the results.
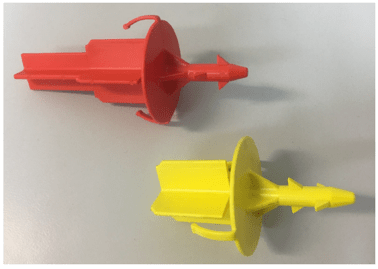
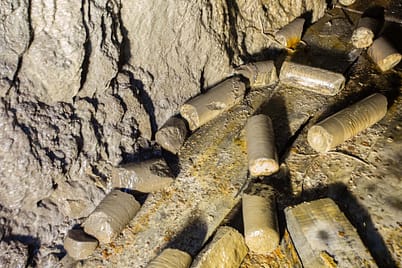
An artificial tunnel environment was constructed with cross-sectional dimensions similar to those in the mine tunneling environment. After an initial base scan of the environment, using the TLS and SR-50 a series of control-panels of known thickness (verified using vernier callipers) were introduced at varying positions in the tunnel. After each control-panel was introduced, changemaps were calculated from SR-50 and the TLS data. Thicknesses of 8, 13, 18 and 30mm were used.
The first assessment of the SR-50 system was to compare comparison results of the test environment with no change against the results using the TLS. Since, there was no physical change to the environment this provided an indication of the repeatability of the system. This assessment was then repeated by placing 8mm, 13, 18 and 30mm boards into the scene and measuring the average thicknesses using the SR-50 and TLS data.
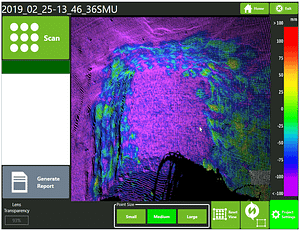
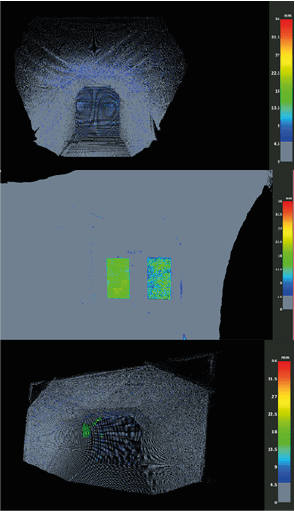
The top image shows the comparison map derived from the SR-50 when no change was made to the environment. The middle shows a comparison of the computed changemap from the TLS control-panel (LHS) and the panel measured by the SR-50 (RHS), both for a 13mm control-panel. The figure clearly shows that the SR-50 gives comparable results to the TLS. The changemap for the TLS gives a more consistent result due to the much higher point density. However, the measured average change across the panels are the same. Control-panels were also attached to the sides and shoulders of the test area and an example changemap is shown in the bottom image.
| Board Thickness (mm) | 0 | 8 | 13 | 18 |
|---|---|---|---|---|
| Smartscan Selection Mode Difference (mm) | 0 | 0 | 0 | 0 |
| Third Party Difference (mm) | 0 | 1 | 1 | 1 |
The above table provides results for the comparison between the average thickness of the control-panels measured using the TLS and SR-50. To assess the accuracy of the automated changemaps created in the SR-50 software, the raw data was exported and thickness maps were calculated in a 3rd party software. The results show good agreement with the on-board solution available at the time of spraying.
Conclusion
By using laser technology and scanning the working area before and after shotcrete application, shotcrete thickness is automatically calculated across the complete working area in near real-time.
To provide an initial assessment of system accuracy, a series of measurements were undertaken in a man-made, controlled area. A series of control-panels of known thickness were introduced into the environment and thickness maps calculated by the SR-50 were compared to maps created using a Terrestrial Laser Scanner of much higher specification. Additionally, the results automatically created by the system were compared against results created manually in a 3rd party software package.
The results showed that thickness maps created using the SR-50 system were comparable to a TLS system. Average control-panel thickness was typically within 1-2mm between the two systems. The investigation shows that the SR-50 is accurate and reliable enough for the shotcreting industry. When comparing to the inaccurate in-situ measuring the industry has previously adopted (such as the ASTM C174 drill core test), the SR-50 can provide reliable results across the whole sprayed face in near-real time. The system is able to:

Provide an accurate thickness report every time a spray is required

Drastically reduce shotcrete wastage by helping the spray application process in achieving its desired thickness in a single attempt

Ensure geological ground control is achieved and upheld during the full shotcreting operation

Help nozzle-persons gain experience in spraying by providing near-real time thickness results.
As shotcreting becomes more common in mining and infrastructure projects around the world, the industry needs to evolve to accept the need for strong QA/QC methods and reporting in near-real time.


Industry
Mining
Scan time
15 minutes
per scan
Location
Nevada,
USA
Size
5 miles of
mine tunnels
Scanned
Pamlico
Ridge
Words by Robert Carrington | Newrange Gold
The state of Nevada is currently the fifth largest gold producer in the world. First discovered in 1849 by prospectors on their way to the California gold rush, gold and later silver caused several booms, with production really picking up in the 1960s thanks to new metallurgical techniques which meant recovery of more gold than ever before. Looking at old mines from the 1800s with our modern perspective provides great opportunities.
Newrange Gold is bringing new things to old places at the Pamlico project, which was one of the highest-grade gold districts in Nevada in the 1880s. Records of the mine workings are lost and the workings have never been systematically studied, leaving an enormous opportunity to map, survey, and sample the old exposures. With 5 miles or more of historic mine tunnels dating from the period of 1884 to about 1928, you can understand why no-one has done it before: it would be too time-consuming and costly to do with conventional surveying.
My company, Carrington Consulting, invested in the ZEB Horizon to expedite surveying, mapping and sampling at our client company, Newrange Gold Corp., at the Pamlico project. Systematically scanning the complex, interconnected workings has generated an unprecedented 3D map of the mine workings and has resulted in greater than 50% savings to date over conventional surveying and mapping techniques.
“Our experience with the ZEB Horizon so far is vastly superior to traditional methods and is an indispensable part of my exploration toolkit.“
In addition to revealing very subtle structural details of the geology, this mapping will form an essential part of modelling historic production and the remaining gold resource at the project going forward. This revolutionary hand held LIDAR scanning technology allows us to complete extremely accurate underground geological and sampling maps, volume analysis of material moved, and careful planning of exploration drilling to better calculate mineral resources in preparation for possible resource definition and mining at Pamlico.
Carrington Consulting’s team is scanning more than 5 miles of tunnels at Pamlico for Newrange. These workings extend over an area more than 1,500 feet long and 800 feet wide with a vertical depth of roughly 300 feet and form an extensive network of adits, tunnels, stopes and raises with at least 30 major entrances that are largely interconnected. Scanning is tied to established surface survey control for registration and orientation so the scan can be accurately carried underground. Underground survey control points are established using a series of spheres to allow Newrange’s geologists to later reoccupy the points to complete the geological mapping.
Many of the mine workings are less than a metre wide and in some cases, they are also less than a metre high following the gold vein, wherever it goes, forming a very irregular, complex network of tunnels and stopes. It would be prohibitively slow and expensive to do this essential mapping with conventional surveying or terrestrial scanning, but the ZEB Horizon makes it realistic for Newrange to accomplish this ambitious goal.
As always safety is paramount, especially when entering old mine tunnels and stopes. With the 100 meter distance capability of the Horizon no one needs to go into unsafe areas. In addition virtually every timber, ladder, and detail are recorded.
We have produced highly accurate data of mine workings up to ¼ mile in length in less than 15 minutes, which changes the game for Newrange at Pamlico. As Newrange gathers information on gold grades from sampling throughout these workings, we are integrating additional layers of information to build a comprehensive 3D model of the geology across the entire area of old underground workings.


Known control points are captured during a scan and automatically compared and matched to the associated coordinates during the processing stage in Connect. A rigid and/or a non-rigid adjustment can be made to the dataset and an accuracy report is exported, highlighting how successful the transformation was. Users can now view and manipulate the processing parameters to ensure a more accurate match between points.
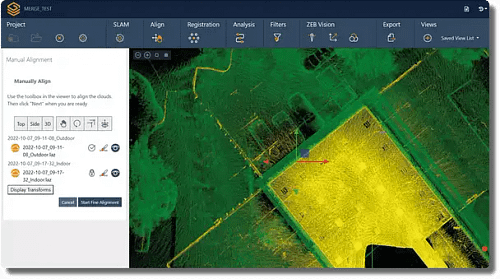
Align multiple scans using a combination of manual and automatic processes. This workflow can be performed on two or more scans in the same project. Users have a choice to export the aligned scans separately or as a single merged point cloud.

Common data capture scenarios, such as UAV, outdoor, indoor, linear, and vehicle, have been characterised in Connect and data processing pre-sets for each environment have been defined. These can be selected at the beginning of the data processing stage allowing this process to be highly simplified.

Both methods match the scan data from a ZEB Locate system with the GPS data collected from the antenna to georeference the point cloud. When a scan starts and ends in the same place, this is classed as “closed loop”. “Open loop” is when the start and end position of a scan are in different locations. Standard SLAM practices apply to both methods of data collection.
Open Loop SLAM for the ZEB Locate is available on request – let’s talk about it.

Common static points are captured during several scans meaning that these datasets can be automatically aligned. A single point cloud is then exported as if the data was captured in a single scan.
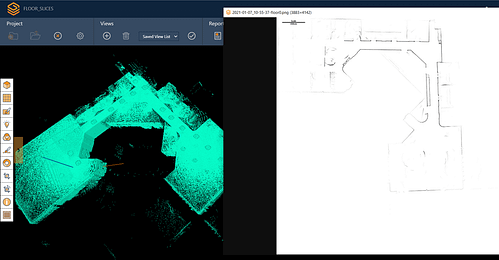
Horizontal and vertical slices can be taken from any location within the point cloud. Horizontal floor slices can also be automatically taken at a given height above the floor as defined in the processing stage.
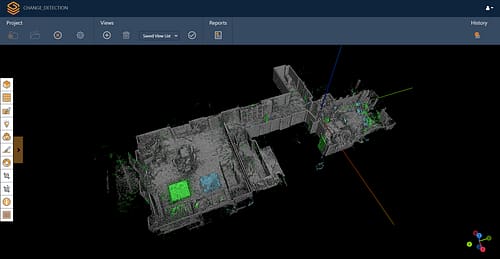
Mostly used in the construction industry, multiple point clouds can be compared and any areas that have changed are automatically highlighted. Point clouds can also be compared with CAD models – for instance to track progress on a construction site – and PDF reports can be generated to present this information.


Some SLAM software algorithms have been made available as open-source on the internet, but they are purely algorithms and not a product that you can take and use off-the-shelf. SLAM is most successful when it is tightly coupled and designed with specific hardware in mind. A generic SLAM cannot perform as well as one that has been specifically designed for a purpose.

Visual SLAM is closer to the way humans navigate the world, which is why it’s popular with robotic navigation. But in the same vein, vSLAM will have the same image-capture challenges as humans do, for example not being able to look into direct sunlight, or not having enough contrast between the objects picked up in the image. These can be overcome indoors, however, you may need to map a forest, tunnel or urban canyon. While SLAM technologies don’t rely on remote data (meaning you can scan areas where there is no GPS), you do need to ensure the SLAM technology you chose operate well inside, outside, in daylight and darkness.

Mapping a property is time-critical. Ideally, you want to make a single visit and gather sufficient data to create a highly accurate 3D model. Ensure the software you choose transforms 3D point cloud data into actionable information in real-time. This allows you to view and interrogate your data whilst still in the field, and make any adjustments, or collect missed data, then and there.

If you’re trying to map an enclosed environment (e.g. tunnel, mine) or a complex, difficult-to-access space such as a heritage building with tight stairwells and uneven floors, you need to use fully-mobile, adaptable technology. Wheel-based systems, often used with the vSLAM camera, will struggle with access. Handheld devices or LiDAR scanners that can be attached to a drone or pole and still deliver accurate results in a rugged environment are best for navigating hazardous spaces.

While vSLAM is able to provide a qualitative high-level map and sense of the surrounding features, if you’re needing survey-quality accuracy and rich-feature tracking at a local level, you’ll need to consider LiDAR. Cameras require a high-frame-rate and high processing to reconcile data sources and a potential error in visual SLAM is reprojection error, which is the difference between the perceived location of each setpoint
and the actual setpoint.

In order to deliver the depth required for high-quality data, a number of depth-sensing cameras are needed with a strong field of view. In most cases, this isn’t possible, especially as cameras with high processing capabilities typically require larger batteries which weigh down airborne scanners, or limit the time of flight. LiDAR is both faster and more accurate than vSLAM, and can deliver detailed point clouds without expensive (and timely) camera processing.