Accelerating Processes and Streamlining Fieldwork at Cabot Survey Partnership

Location
Johannesburg, South Africa

Scan time
Approx. 10 minutes per scan

Size
Range from 400m2 to 20ha

Scanned
Large exterior spaces
Industry
Surveying
Cabot Survey Partnership is a leading South African surveying company that provides civil and structural surveys, and CAD services, to a range of clients in the AEC and mining industries. To stay ahead of the competition, Cabot is always looking to innovate, implementing technology that can help deliver accurate and comprehensive results faster.
In this case study, we’ll explore Cabot’s use of handheld LiDAR scanners to speed up processes and reduce fieldwork.
The decision to use handheld LiDAR
Traditional methods for surveying
Cabot originally used static-based LiDAR solutions to carry out surveys and collect data for their clients. While this method is highly accurate, they realised that they needed to produce similarly accurate results faster, to reduce overall fieldwork. They required a solution that could easily and efficiently capture large spaces ranging from 400m2 to 20ha.
Transforming a small business
As a small business, balancing workload with capacity is vital for Cabot Survey Partnership.
To stay competitive, Cabot invested in handheld LiDAR technology, that would have a direct and positive impact on their business by:
Gustav Fick, Segment Manager at OPTRON (Pty) Ltd, the local supplier of GeoSLAM technology in South Africa, understood Cabot’s business requirements and recommended a GeoSLAM solution to help their business expand. Consequently, Cabot made the switch to handheld LiDAR, resulting in streamlined projects and enhanced time efficiency.
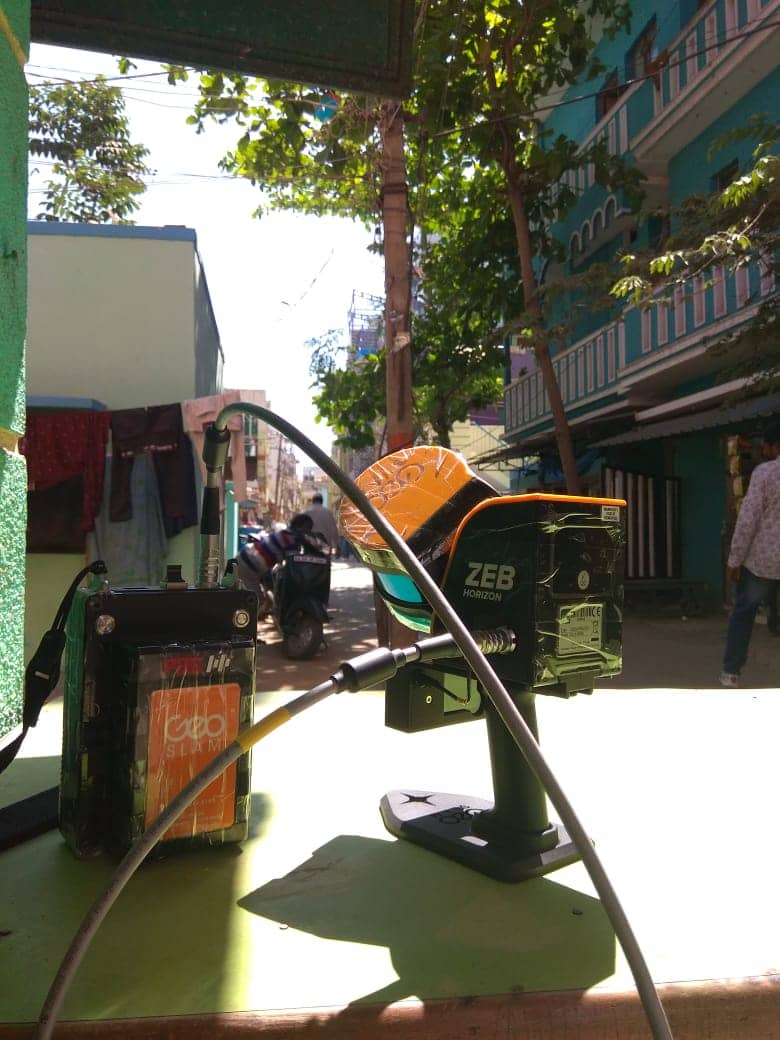
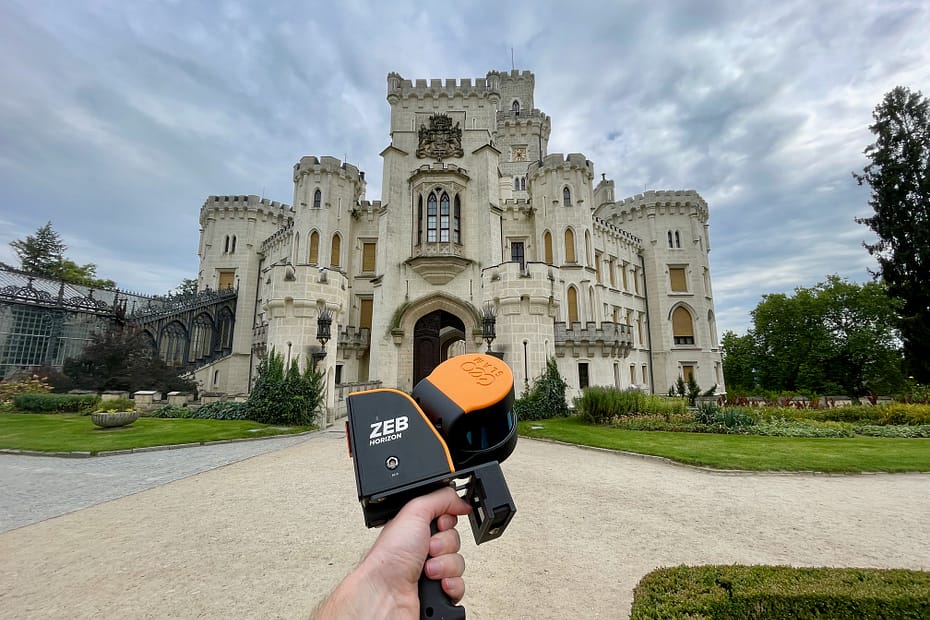
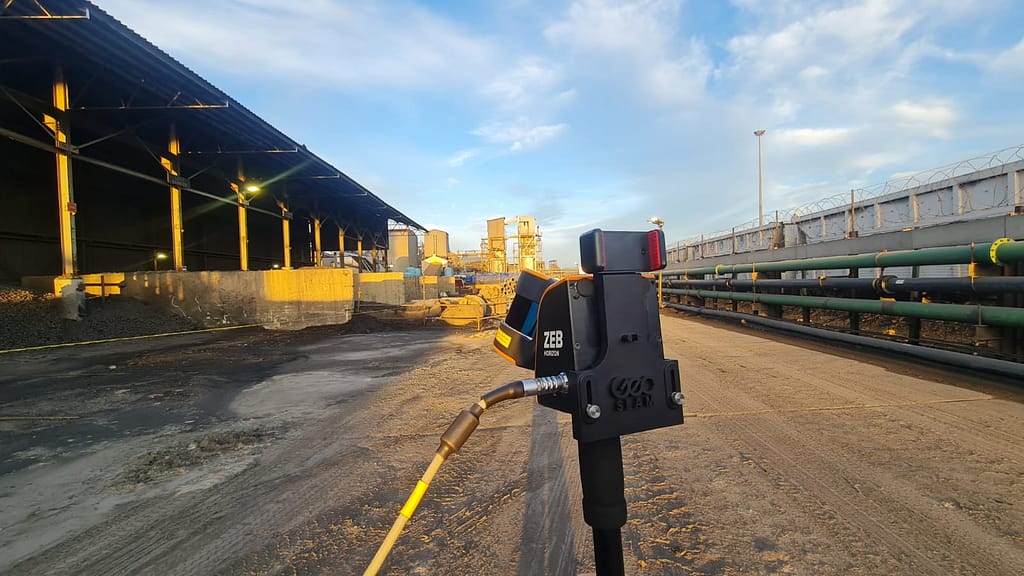
How Cabot use the ZEB Horizon
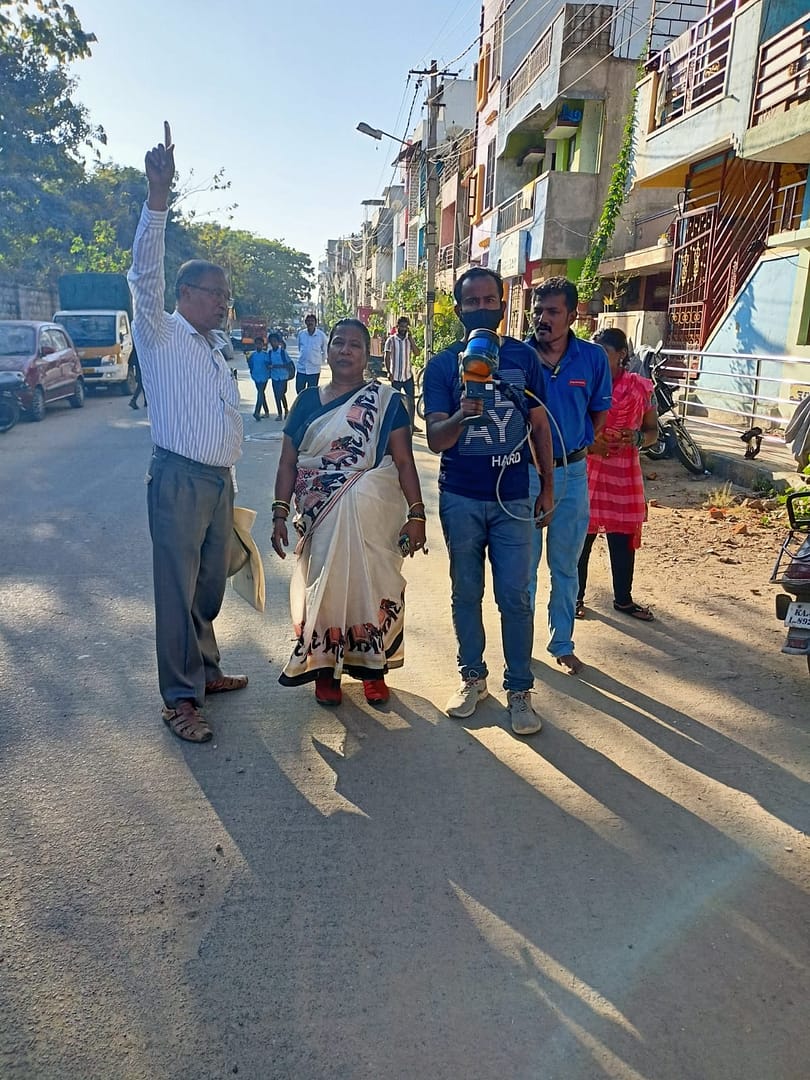
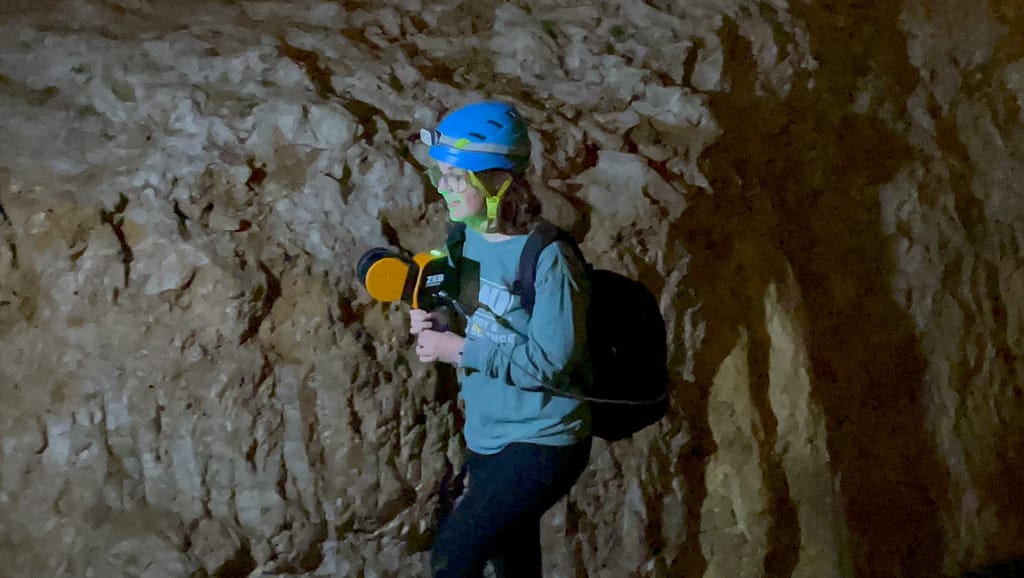
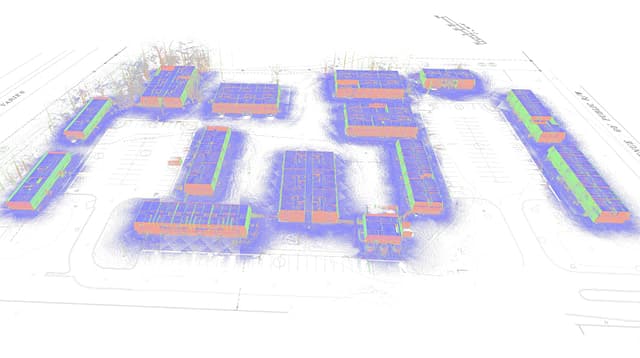
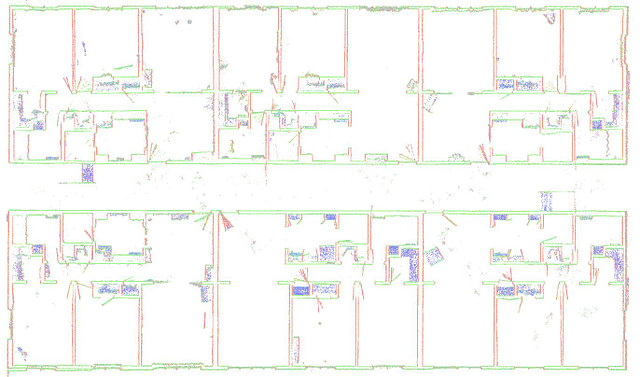
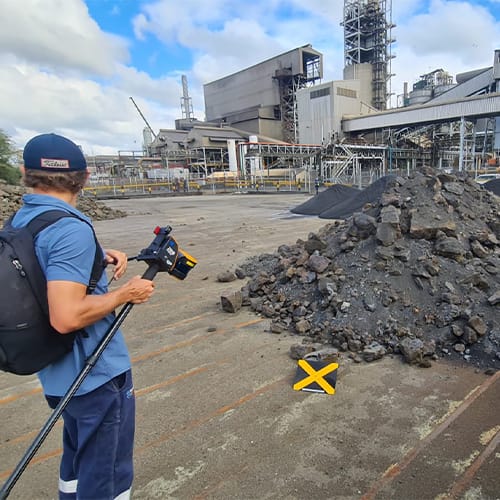
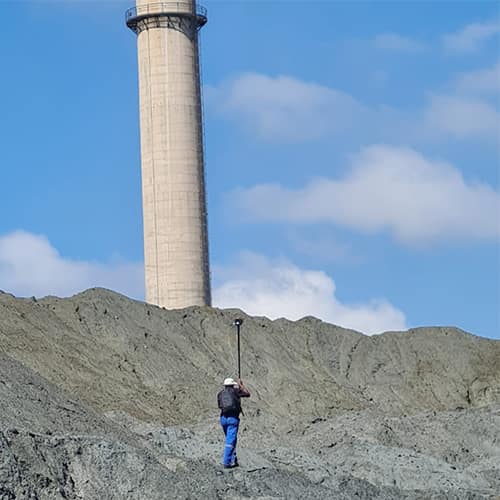
In 2019, Cabot acquired a ZEB Horizon and became the first private surveying company in South Africa to use the technology. The ZEB Horizon’s ease of use and lightweight nature help Cabot deliver accurate and comprehensive results faster, with only one person needed onsite to capture data. This allows Cabot to cover multiple sites simultaneously, reducing the overall time spent collecting data.
The laser scanner’s adaptability to the range of solutions Cabot offers means they can carry out 50-60 scans per month, with most scans taking under 10 minutes, depending on the particular solution and scanning environment.
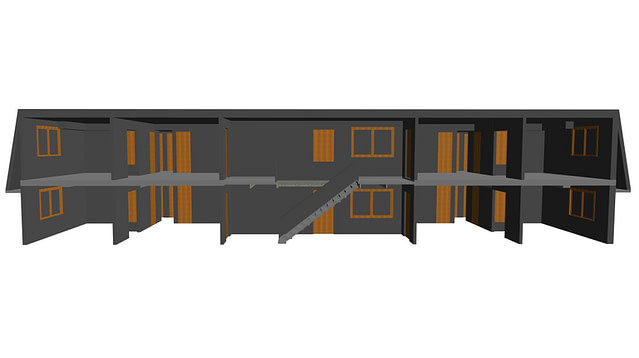
Clients have commented on the quality of the scan deliverables, stating that they can now visualise the data points better. They are also impressed with the overall results of the project.
Solutions
Cabot uses the ZEB Horizon for a variety of applications resulting in reduced fieldwork, by roughly 80%. The laser scanner now works across three primary surveying solutions.
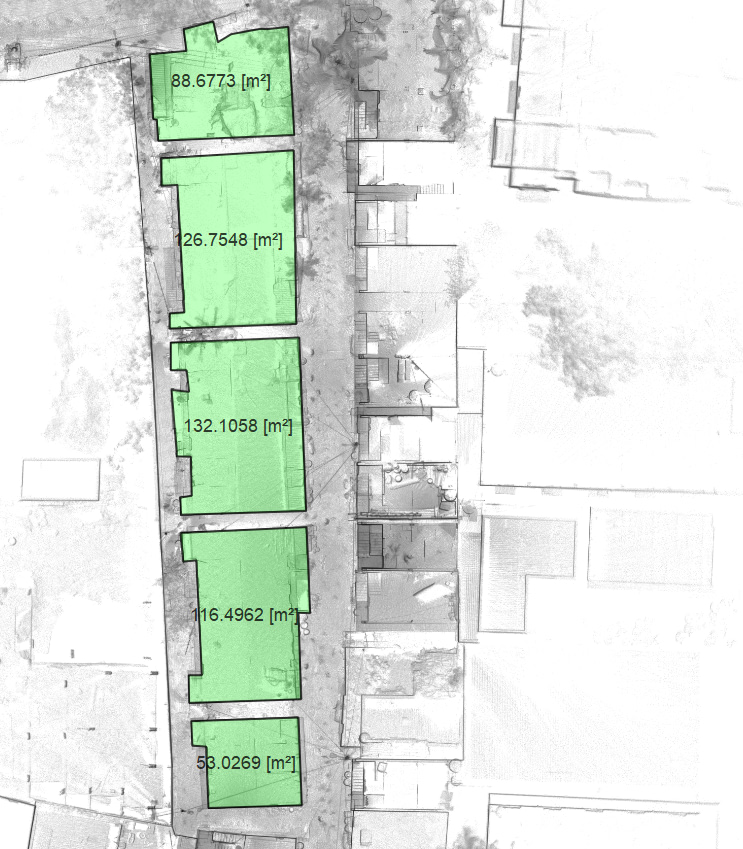
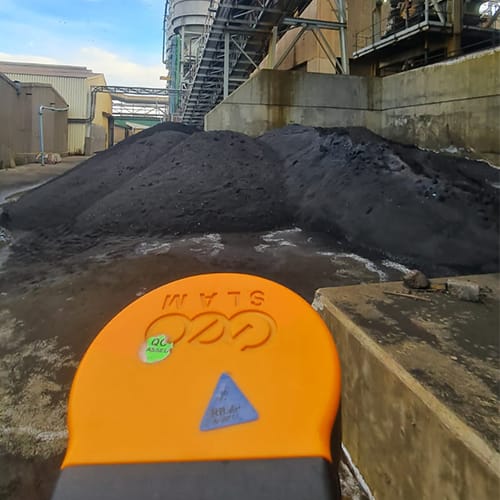
Stockpile measurements
They carry out 10-15 scans of stockpiles per client, each month. The walk-and-scan method of GeoSLAM technology is vital for scanning stockpiles, especially those inside buildings or in between multiple structures. Within an hour of processing the data, Cabot begin calculating measurements of the stockpile, delivering a fast end-to-end solution.
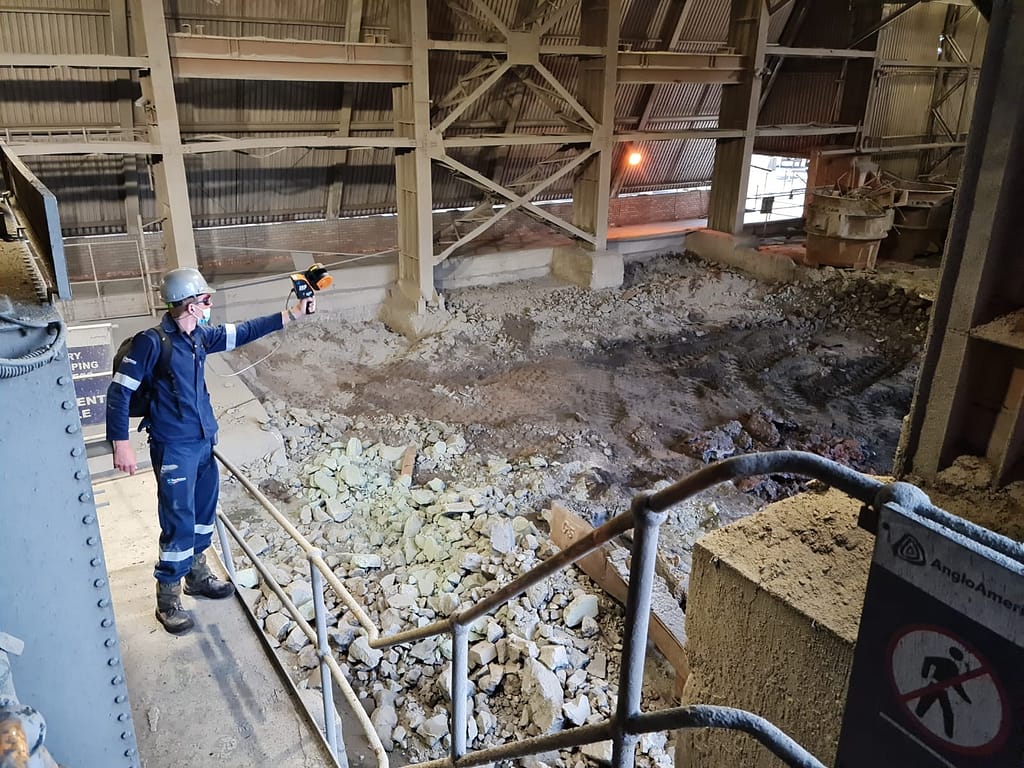
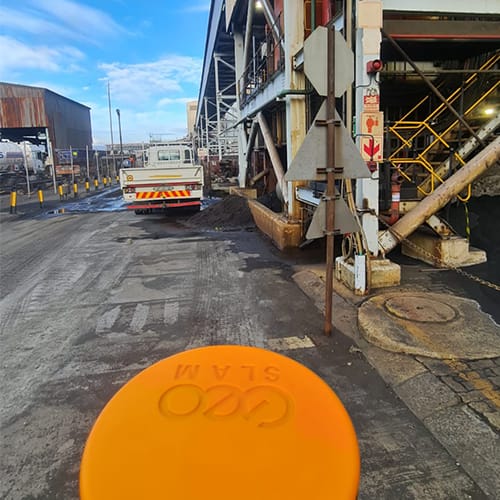
According to Arnold Bothma, Managing Director of Cabot Survey Partnership, surveying a concentrated area in a platinum processing plant used to take about two hours with a robotic total station. However, with the ZEB Horizon, the process now takes about eight minutes, and the actual model takes around 30-40 minutes, resulting in significant time savings for the team. This increased efficiency allows them to spend more time analysing the data rather than capturing it.
Infrastructure applications
Cabot utilises the ZEB Horizon to determine the precise distance of cable racks, which are structures designed to organise long distances of cables or wires, across large areas. The accuracy of these measurements is critical, especially in cases where the cables are one-piece, and the lead time for ordering a new cable is as long as six months. With the ZEB Horizon, they were able to obtain the necessary data promptly, and provide clients with the exact measurements required for cable orders. Thanks to the scanner, clients were able to order cables with confidence, knowing that their measurements were precise and accurate.
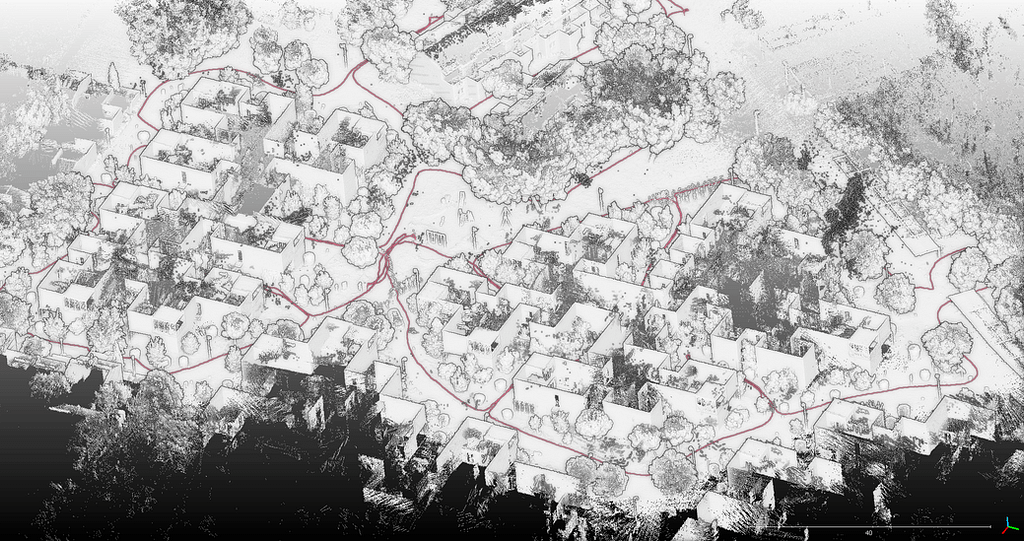
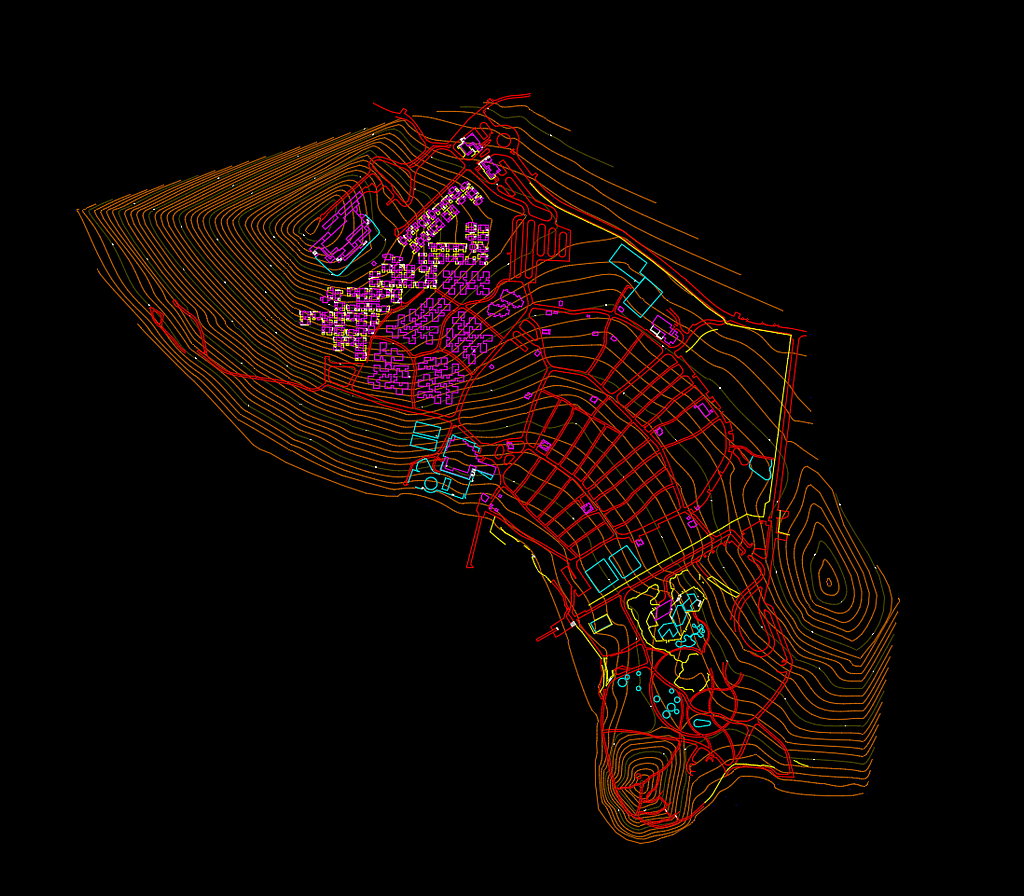
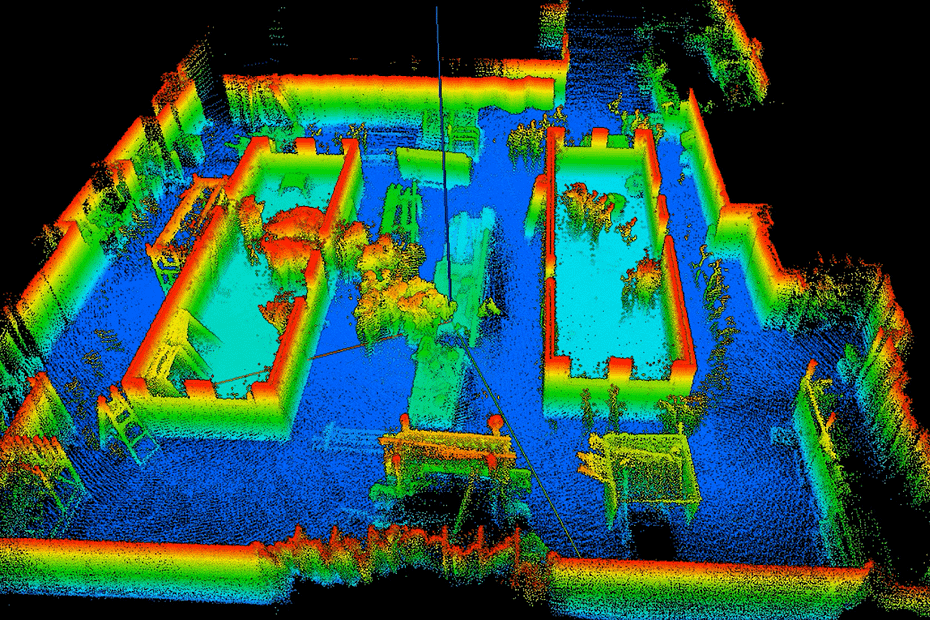
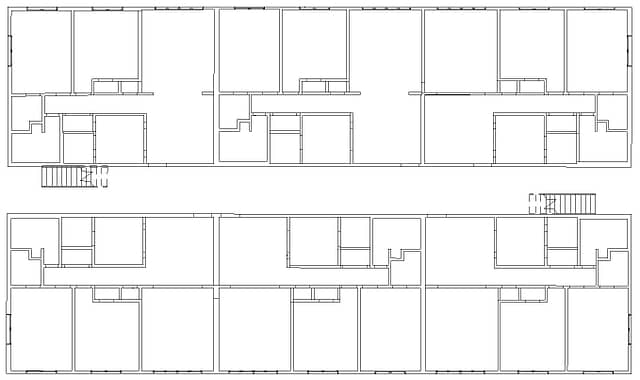
Cabot create their deliverables, including stockpile calculations and topographical detail contour plans, using Trimble Business Centre.
Conclusion
The speed, accuracy, and flexibility of the ZEB Horizon have been extremely beneficial for Cabot Survey Partnership. The laser scanner’s capabilities have reduced their time onsite, increased productivity, and expanded the total amount of projects they can undertake. The speed of capture has led to safer data collection for surveyors, and clients receive deliverables faster. Using GeoSLAM technology, Cabot has carried out approximately 1000 scans, and this number continues to grow.
With handheld LiDAR technology, Cabot Survey Partnership is setting the bar for efficiency and accuracy in the survey industry.
Get in touch
If you’d like to learn more about how GeoSLAM solutions can help you, submit the form below.