Join this webinar with Jon Romero, owner of Scout Aerial Solutions, to learn about the benefits of versatile mapping solutions and how small businesses can use innovation for long-term success and cost-effectiveness. Jon is an advocate of implementing new technologies to suit his growing business and the needs of his clients, for long term and cost effective success.
Watch this webinar to learn how educational institutions are inspiring the next generation of surveyors using GeoSLAM handheld LiDAR scanners.
Hear from three guest speakers from different Universities and Colleges across the world discussing their own individual experiences uses handheld LiDAR scanners to support education and inspire their students.
Key takeaways:
What is SLAM?
How it powers GeoSLAM technology
Why use GeoSLAM for Education?
Insights from Ángel A. García Jr, James Madison University
Insights from Blair Bridger, College of the North Atlantic
Smarter Construction: Benefits of Handheld SLAM Mapping
Monitoring construction progress comes with many challenges and we’d like to help you solve them with SLAM mapping. Watch this webinar to learn how to track the progress of small and large construction projects using mobile LiDAR and automated analytics.
Key takeaways:
What is SLAM?
The main challenges when monitoring construction progress
How can handheld SLAM mapping solve these challenges in small and large projects?
Understand how to map larger spaces with GeoSLAM’s ZEB scanners
GeoSLAM Volumes: Stockpile Volume Measurements Made Easy
Handheld laser scanners can determine accurate stockpile volume and tonnage measurements without the need for GPS. Walk and scan, or attach the scanner to a drone, pole, or vehicle for remote monitoring of hazardous environments. GeoSLAM’s Volumes software automates data processing to turn your scan data into actionable graphical and numerical data for real-time decision making to effectively monitor and manage your stockpiles.
Key takeaways:
GeoSLAM Volumes – what is it, main uses and key features
How to automatically process the captured data
View the volume and tonnage results in the data output
How LiDAR Can Help Detect Change at a Community Micro Hydro Power Generation Site
Location
Congleton, UK
Scan time
25 Minutes
Size
100m x 100m Area
Scanned
Micro Hydro System
Industry
Surveying
How Using Micro Hydro Power Generation Produces Clean Energy
Discussions around climate change, and how we can lessen our environmental impact, have become increasingly more relevant in recent years. This has driven some companies and communities to explore different ways of producing renewable technologies, to reduce dependency on fossil fuels. One method for gathering renewable energy is by using Micro Hydro power generation.
Hydroelectric power generation relies on a constant water cycle. Nature is perpetually replenishing this, making it a good clean source of energy. This method of producing electricity using hydroelectric power generation is what the Congleton Hydro Project has set out to achieve.
Dane Valley Community Energy Ltd (DVCE), a non-profit community benefit society, developed and constructed the project. DVCE is a volunteer led organisation, run by a small team of volunteer directors, who have all worked within Engineering and Management Companies. Funded by the community of Congleton, the project aims to generate enough carbon-free electricity, using hydroelectric power generation, to power 60 homes within this local area.
Utilising an Archimedean Screw for Micro Hydro Power Generation
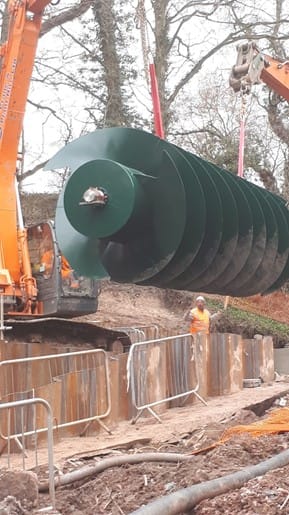
For this project, the team set up a Micro-Hydro System, including an Archimedean Screw. The hydroelectric energy is generated by the nearby Havannah Weir River. The energy is extracted by using the water flow to turn the Archimedean Screw, which is connected to an electrical generator. Having constructed the whole system in just 12 months, DVCE were able to produce their first load of electricity in a relatively short space of time.
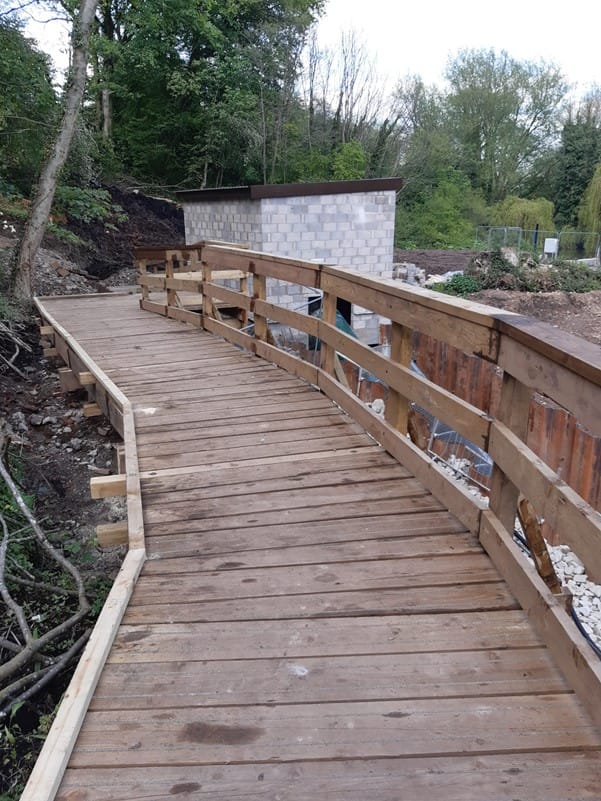
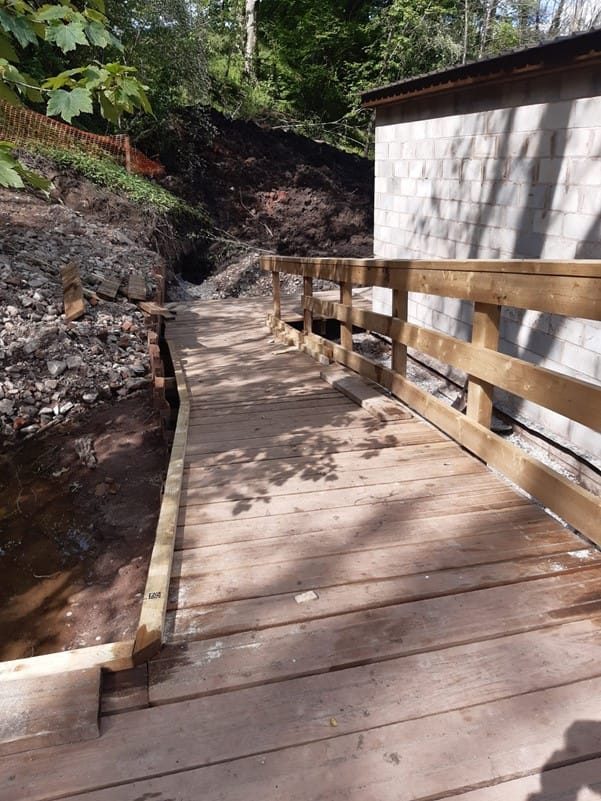
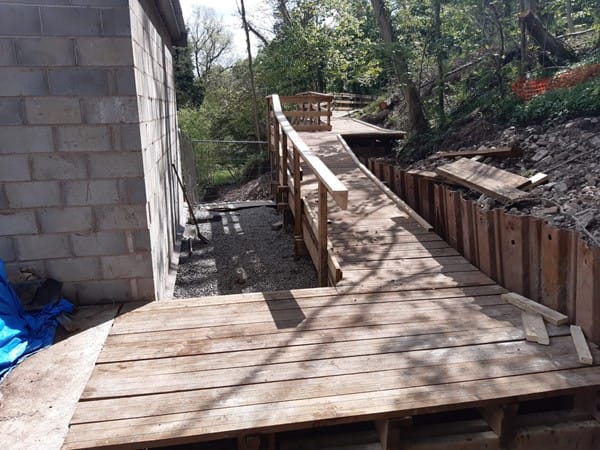
The area surrounding the Archimedean Screw required significant and extensive ground works, together with a substantial walkway, powerhouse, and piped water inlet system. Whilst designing the project, it became apparent that a core worry would be movement of the terrain, due to weather and time. As a result, they decided they needed to frequently monitor this surrounding area.
The Archimedean Screw has a life expectancy of 40 years, and the team hope to make returns on their investments in the next 20 years. In addition to generating clean energy, a core objective is to generate an annual surplus, which will fund the local community. It is therefore essential that any change in land stability does not impact the planned generation. The team decided that a monitoring system would help identify any movement so that timely corrective action could be taken.
Tracking Changes in the Land and Facilities Management
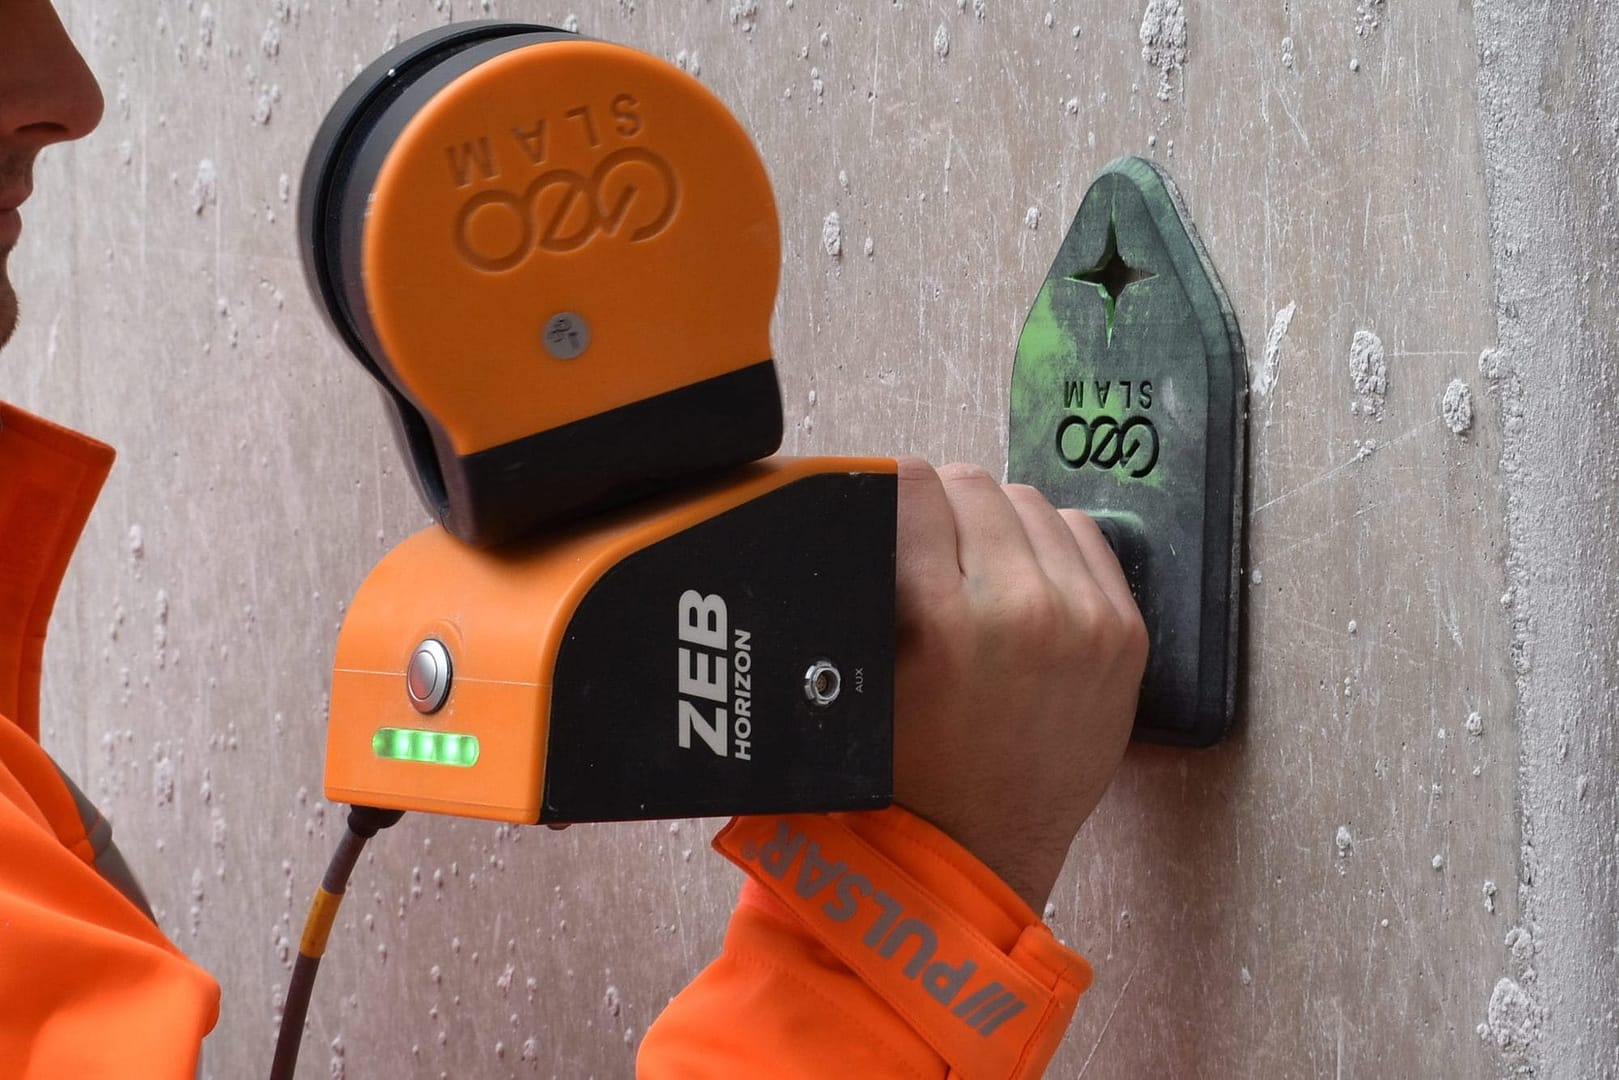
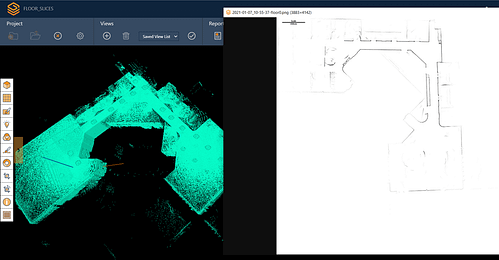
Via a family member (Dr Jonathan Owen), the team acquired a 3D handheld laser scanner, GeoSLAM’s ZEB Go. The handheld nature of the scanner will mean they can track land movement and vegetation rates over time. In addition, they can map the on-site building to help with facility management and storage.
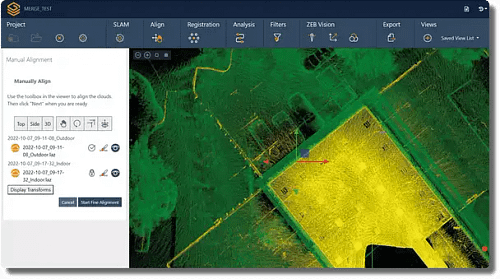
GeoSLAM Connect’s Stop and Go Alignment can help the team align these scans, as it would give them a more accurate view of the exterior and interior areas together.
GeoSLAM technology is ideal for this type of work, due to the uneven terrain. The mobile device can map an area by simply walking around, whereas systems that require a more complicated setup would struggle to scan the area promptly.
The Benefits of GeoSLAMs Technology
The ZEB Go’s speed of capture enables DVCE to carry out scans of the 100m x 100m area surrounding the Micro-Hydro System in just 25 minutes. As the team are detecting change in the ground movements and vegetation, they can frequently scan the area to track any issues that may arise. A great way to document the area, as frequently as DVCE need.
The ZEB Go’s ease of use means the team would not need to be survey trained for the scan, unlike more complicated to use scanning hardware. Further, the ZEB Go’s capabilities save all the team from having to repeatedly return to the site, as just one individual is needed.
The team were impressed with the ease that the ZEB Go was used to survey the complete site, with no tripods being needed and no complicated set up.
Creating Accurate Georeferenced Point Clouds
Whilst capturing the data, the team laid down control points using a GNSS receiver. This allowed the team to georeference the data using GeoSLAM’s software. Now the surveying pins are in place, the team can simply georeference the data for each scan they conduct.
Implementing control points was important for DVCE as it allows for clear comparisons between multiple scans of the same area. Georeferenced data places the scan in the real world and makes the data even more accurate. This will benefit the team as they continue to scan the Micro-Hydro System’s surrounding areas in the future and detect any gradual change.
The ZEB Go delivered an accurate 3D replica of the area that continues to help DVCE in their project. The versatility of the ZEB Go and resulting point cloud means the team can look into new ways to interpret the data – protecting this vital equipment for both the environment and local community.
Jonathon was the lucky winner of our ‘Win a ZEB Go Competition’ at GeoBusiness 2021.
If you’d like to learn more about how GeoSLAM solutions can help you, submit the form below.
On-demandWebinar
Watch a previous webinar in your own time
Introduction to Handheld Laser Scanning
Handheld laser scanning has become a crucial tool for many businesses who need to collect geospatial data. Compared to the more traditional methods, handheld laser scanning is considerably more efficient and makes it much easier to navigate through difficult spaces such as underground or narrow passages. GeoSLAM handheld LiDAR mapping solutions use next generation SLAM technology to simultaneously localize and map a space up to 10 times faster than traditional methods.
If you’re new to handheld laser scanning or think your company could benefit from this technology, then this webinar is for you.
Key takeaways:
What is a handheld laser scanning and how does it compare to a static scanner
Which industries are using this technology and how are they using it?
Control points are points within a given area that have known coordinates. They are a key tool in the geospatial industry and can be utilised in a variety of ways, including georeferencing point clouds and aligning aerial images to terrestrial data. By using control points, surveyors are able to accurately map larger areas and position overlapping surveys of an area together. They can also be used in non-geospatial industries, such as construction and mining, to show clear temporal comparisons between multiple surveys of the same area. This method of georeferencing is also referred to as adjust to control.
Previously, checkerboards and spherical targets have been used as control markers – these items are captured in surveys and can be identified for georeferencing or aligning. The main drawback with these methods is that they rely heavily on human interpretation when processing, meaning that the processed datasets may be susceptible to an increased amount of error.
When capturing handheld surveys, GeoSLAM systems are able to collect reference points. These can then be matched with known control points to reference scans and increase the level of accuracy.
What makes GeoSLAM referencing different?
More accurate: GeoSLAM scanners are used with known control points and survey grade pins, rather than more traditional moveable targets. This reduces the margin of error within point clouds.
Save time: using known survey control points means there is no need to manually position individual targets before every scan. Data capture can then be repeated regularly, faster, easier and with no concerns that reference points are captured in different places each time.
Safer: in dangerous or inaccessible areas, targets are not required to be physically positioned on pre-defined control points prior to each scan. This reduces the time exposed to hazards and unsafe areas.
Industries using control points
Geospatial
Easily reference point clouds and produce reports highlighting accuracy values.
Mining
Regularly monitor site operations (e.g. stockpiles) and hazards.
Construction
Compare changes over time and map progress onto predetermined CAD/BIM models.
Using control points with GeoSLAM
Capture
All GeoSLAM ZEB systems are able to capture reference points using the reference plate accessory. These reference points can simply be measured by remaining stationary for periods during a scan and will be recognised during the processing stage. Points can be captured from a horizontal or vertical position, depending on which ZEB system is used, making it easier than ever to georeference datasets.
Process
Using the Stop & Go Georeferencing workflow in GeoSLAM Connect, datasets can be automatically referenced through a rigid or non-rigid transformation.
Rigid Transformation
Scans are rotated and adjusted and reference points are matched to the known control points without changing the scale factor. A single transform is applied to every data point in the point cloud.
Non-Rigid Transformation
The scale factor of datasets is altered to suit the control points – every data point is moved to a new position; this means the relative positions of these points also changes. This method is better suited for poor SLAMenvironments.
A clean georeferenced point cloud is produced using both methods. An accuracy report of the transformation is also generated and includes an RMS error value.
Point clouds with endless possibilities
Once georeferenced using control points, point clouds can be optimised further using leading third party software:
Comparisons with existing CAD/BIM models
Point cloud to point cloud registration showing changes over time within a given area
CAD/BIM model creation
For more information about our third party partnerships, head to our integrations page.
Case Study
Mapping hazardous mines under intense time constraints
Beck Engineering, an Australian mining engineering consultancy specialising in mining and rock mechanics analysis, needs to rapidly map mines under intense time constraints using versatile technology which is adaptable to any environment. GeoSLAM’s handheld mobile mapping solution was chosen as it is compact, portable and delivers a high level of accuracy. With GeoSLAM’s “go-anywhere” 3D technology in hand, Beck Engineering has been able to supply invaluable data regarding the direct effects of mining to better understand the implications of a deforming rock mass. Beck Engineering is now able to accurately measure the shape of an excavation or tunnel over time. As a result, tunnels are safer, better designed and more cost efficient.
We have continued to use GeoSLAM products as they have proven to be affordable, lightweight and sufficiently robust devices for their application underground. GeoSLAM continues to produce a high-quality device that is at the forefront of practical mobile laser scanning devices. – Evan Jones, Senior Rock Mechanics Engineer at Beck
Increasing Productivity in Architecture with Mobile Mapping
In this webinar we are joined by GeoSLAM customer SLA Architects. Jordan JD Dixon is an Architect who specialises in renovation work. SLA wants to stay on the cutting edge of technology, and were using some of the traditional tools like laser distance measures and phone photography, their goal was to improve on accuracy.
Key takeaways:
Learn about the GeoSLAM ZEB Family of laser scanning solutions
How GeoSLAM technology fits into BIM-LOD
Learn about SLA architects, the type of work they do and the role of GeoSLAM technology in their workflow
Iowa Department of Transport uses SLAM to create 3D models of salt stockpiles
Industry
Mining
Scan time
10 mins per scan
Location
Iowa, USA
Size
109 stockpiles
Scanned
Salt stockpiles
Words by Tina Greensfield | Iowa DOT
At Iowa State DOT (Department of Transport) it is our job to make sure over 24,000 miles of road remains clear and safe to use in winter. We have 109 maintenance areas across the state where stockpiles of salt are kept for distribution. Each facility can each hold up to 1200 tonnes.
Throughout winter salt is loaded onto trucks and spread on roads to stop the surface from freezing. Pay loads are measured in weight as salt is loaded onto spreading trucks and supplies are depleted. But as the salt is used, there is a clear discrepancy between the volume of salt in the shed and the paper records – it is not reliable to just look inside a half-empty shed and assess how much material remains.
If volume of salt is too low or we don’t know how much is available, we may find ourselves forced to make snap decisions about redistribution which is both costly to the state and inconvenient to residents and businesses alike.
We needed another solution and following a few severe winters where salt reserves around the country ran out, the Great Lakes froze and shipments were halted we were determined to invest in a reliable measuring process for managing stockpiles in future, which led us to a GeoSLAM volumes solution.
“In terms of speed and accuracy, this was a real game changer for us!“
Using the handheld SLAM device, we can produce a three-dimensional model of the stockpile in just a few minutes. We have never experienced this level of accuracy before and capturing data was as easy as surveying the site with the naked eye.
The surface of the stockpile is very uneven with lumps on one side and big cliffs on the other where loaders have dug-out salt for spreading, in the past our ‘best guess’ used to involve looking at the stockpile against some markers on the walls of the shed which provided limited accuracy to say the least, so this was a real game changer for us.
Data is then processed using GeoSLAM Hub and imported to the volumes software. As the granules vary in size, we apply a bulk density value as well as defining a floor and perimeter of each pile calculate the total volume of the stockpile in tonnes.
From start to end, the entire process took around twenty minutes. We now have depot staff going out and scanning the stockpiles regularly. This new level of insight means we don’t have to worry about compromising road users’ safety across the state of Iowa as we always know what volume of salt we have available to use.
Bloom Cloud Engine is a powerful on-premise point cloud editor ideal for use in Design, Fabrication, and Construction applications. Easy to deploy across your project team, BloomCE allows users to optimize and condition the point cloud data from all reality capture modalities, providing the fundamentals for Asset Management and Digital Twin project requirements.
Blacklight, based in Romania, focuses on information technology that captures, measures and visualises data used in various fields of activity through providing valuable solutions.
Cybernetech Corporation, based in Japan, is a specialised trading company that offer advanced information and communication equipment and geospatial information technology.
Seiler Instrument is an American company that specialises in distributing surveying software and instruments serving industries such as surveying, engineering and construction.
Favre, Développement & Foresterie, based in Switzerland, are experts in geomatics and work with public and private landowners for forest management and environmental heritage.
3DT Digital Manufacturing is an Australian company that use the latest technology to adapt to changes in real time. It aims to help their customers become more efficient and productive.
Sigma Mascot, based in Hong Kong, provides solutions for 3D Laser Scanning, Geospatial systems and BIM services for industries such as Forestry, Construction and Real Estate.
Precision Laser & Instrument is an American company that offers comprehensive positioning solutions for the Construction, Survey, and GIS industries. They ensure high returns on investments and business success.
Export your point cloud into a range of formats, including LAZ, LAS, PLY and TXT. Datasets can also be exported as structured or unstructured E57 files, both of which include embedded panoramic images.
Surface normals at each point can now be computed from PLY and E57 formats, allowing users to export colourised data and create a high-quality polygonal mesh in third party software .
Stop and Go Georeferencing
Known control points are captured during a scan and automatically compared and matched to the associated coordinates during the processing stage in Connect. A rigid and/or a non-rigid adjustment can be made to the dataset and an accuracy report is exported, highlighting how successful the transformation was. Users can now view and manipulate the processing parameters to ensure a more accurate match between points.
Manual Alignment
Align multiple scans using a combination of manual and automatic processes. This workflow can be performed on two or more scans in the same project. Users have a choice to export the aligned scans separately or as a single merged point cloud.
JP Interactive Viewer
Leverage your GeoSLAM data by integrating JP Interactive Viewer into your workflows. JPIV allows you to unlock the full potential of your reality capture data and distribute actionable insights across your teams.
Our support team will be available for GeoSLAM Care customers on:
Monday 26th, 8 am – 4 pm (GMT)
Tuesday 27th, 8 am – 4 pm (GMT)
Wednesday 28th – 31st December – standard support hours
Monday 2nd January, 8 am – 4 pm (GMT)
From Tuesday 3rd January – standard support hours resume
Test pop-up
fsikajntgfitdshagklndsakj;gnjkdasklngklsa
Click here to view the release notes.
Autodesk Recap
Autodesk Recap contains tools for the manipulation and interpretation of high quality point cloud data and to aid designers and engineers in their creation of 3D models for real-world projects and assets (e.g. buildings and other infrastructure). It’s integrated design features help to streamline workflows, for example Scan to BIM. Recap is used to create initial design projects that users can then take into other Autodesk modules (e.g. Revit, Navisworks, AutoCAD).
Autodesk Navisworks
Autodesk Navisworks is a comprehensive project review solution that supports co-ordination, analysis and communication of design intent and constructability. The software can be used as a common data environment (CDM) for multidisciplinary design data created in a broad range of Building Information Modelling (BIM) packages. Using the tools within Navisworks, users can anticipate and minimise and potential problems between the physical building and the structural model.
Autodesk Revit
Autodesk Revit is a building information modelling (BIM) software. It contains tools which allows for planning and tracking throughout the building’s lifecycle. The software also allows multiple disciplines to collaborate more efficiently and make more informed decisions early in the design process. As GeoSLAM’s hardware allows for quick data capture, the equipment can be used to scan any existing buildings with the purpose of using the data to produce a digital twin.
Orbit GT allows users to capture and manage available 3D data (LiDAR data and imagery), extract a range of features for map production and make data sharable. All Orbit modules are ready to be used with 3D data from indoor, oblique, UAS and mobile mapping projects with other extensions that can be added to the Publisher and Orbit Cloud. Orbit can be used with the ZEB Discovery solution.
ContextCapture
ContextCapture is a reality modelling tool, allowing for the import of any point cloud and imagery data for the creation of high resolution reality meshes. These realistic meshes are accurate representation in 3D with high resolution RGB values of any scanned environment. By using GeoSLAM data in ContextCapture the users are able to create indoor reality meshes, which has been never possible before.
Microstation
Microstation is a 2D/3D software for designing building and infrastructure projects. It includes building information modelling (BIM) tools to document and assess any type of asset throughout its lifecycle. GeoSLAM solutions are often used in Microstation in the underground mining sector and to assess the current stage of any built environment, update the design model, and generate BIM information.
Deswik
With the GeoSLAM Connect stop-and-go georeferencing feature, users can easily georeference headings from known positions and map for analysis of overbreak, underbreak, undercutting and blast roughness calculations. This information is used within Deswik Mapping to analyse headings and levels.
Esri
Outputs from GeoSLAM’s solutions can be input to Esri’s GIS programs and apps, including ArcPro, ArcDesktop, ArcGIS Online and ArcScene. Join point clouds with local geodata or classify and edit scans based on their geography and statistics.
Micromine is a detailed and diverse mining software that provides solutions including modelling, estimation, design, optimisation and scheduling. Once data is exported from Connect it can be imported into Micromine and easily converted into wireframes. These can be used in Micromine for further studies into volumetric slicing, over and underbreak analysis, geologic modelling, face mapping and many more.
Terrasolid provides tools for data processing of airborne and mobile mapping LiDAR data and imagery. It includes different modules for tasks like data manipulation, calibration, georeferencing, point cloud classification, modelling and many more. It is a very powerful tool for a variety of industries, surveyors, civil engineers, planners, designers. Full, UAV or lite versions of Terrasolid modules are available for both MicroStation or Spatix software. All GeoSLAM products are compatible with Terrasolid and GeoSLAM data can be enhanced and edited with this software.
Floorplanner
Floorplanner allows you to draw accurate 2D floorplans within minutes and decorate with over 150,000 items from kitchen appliances to tables and chairs. Data is exported from GeoSLAM Connect in PNG file format with a scale of 1cm per 1 pixel and can be taken into Floorplanner.
Unity
GeoSLAM 3D point cloud data can be imported into Unity 3D Game Engine to generate interactive 3D scenes, where users can create 3D BIM models with textures and explore the space in 3D photorealistic environments.
Unreal Engine
Although Unreal Engine is mainly built for developing games, increasingly users are starting to use it to develop VR applications for understanding the current conditions of buildings, infrastructure and similar. Unreal Engine with a point cloud plugin can be used to visualise GeoSLAM point clouds in VR, which allows for collaboration, simulation and the understanding of current conditions of any scanned environment. Additionally, Unreal Engine tools are completely free.
Veesus Arena4D
Arena4D is a software package for marking up, annotating and editing 3D point cloud data containing a various export capabilities. It has a powerful and simple to use animation package which allows users to visualise massive point clouds in a simple way. GeoSLAM data can be simply uploaded and used in this package for the assessment of the current conditions of any structure, comparing differences between captured data (as built) to designed model (as designed).
Pointfuse
Pointfuse generates 3D meshes from point cloud data and classifies them to building ceilings, walls, windows and other features in IFC format. By using GeoSLAM data with Pointfuse users can very quickly create a classified BIM model with minimal manual input or expertise needed.
MineRP
MineRP has a Spatial DB that uses GeoSLAM data to represent visually the real environment of the underground mine. The software uses other data layers to overlay information on the digital landscape for decision making and tracking.
Pointerra
Pointerra provides a powerful cloud based solution for managing, visualising, working in, analysing, using and sharing massive 3D point clouds and datasets. Pointerra allows users to simply visualise and interrogate GeoSLAM data from anywhere.
Nubigon
Nubigon is a software solution that allows users to seamlessly interact with large point clouds and create visualisations and animations. Take your GeoSLAM point cloud data into Nubigon to create eye-catching flythrough videos.
Here is an example of a visualisation created in Nubigon using GeoSLAM point cloud data:
SLAM Environmental Pre-sets
Common data capture scenarios, such as UAV, outdoor, indoor, linear, and vehicle, have been characterised in Connect and data processing pre-sets for each environment have been defined. These can be selected at the beginning of the data processing stage allowing this process to be highly simplified.
Closed and Open Loop Georeferencing
Both methods match the scan data from a ZEB Locate system with the GPS data collected from the antenna to georeference the point cloud. When a scan starts and ends in the same place, this is classed as “closed loop”. “Open loop” is when the start and end position of a scan are in different locations. Standard SLAM practices apply to both methods of data collection.
Open Loop SLAM for the ZEB Locate is available on request – let’s talk about it.
Stop and Go Alignment
Common static points are captured during several scans meaning that these datasets can be automatically aligned. A single point cloud is then exported as if the data was captured in a single scan.
Floor Slices
Horizontal and vertical slices can be taken from any location within the point cloud. Horizontal floor slices can also be automatically taken at a given height above the floor as defined in the processing stage.
Change Detection
Mostly used in the construction industry, multiple point clouds can be compared and any areas that have changed are automatically highlighted. Point clouds can also be compared with CAD models – for instance to track progress on a construction site – and PDF reports can be generated to present this information.
Queued Processing
Import multiple .geoslam files into Connect for processing and the scans will be processed in the order they were imported. The size of the queue can be defined by the user.
Enquire about the ZEB Horizon RT
Error: Contact form not found.
If your internet connection allows, move the Point Budget slider to the maximum amount available to view all the points in the cloud.
Making the point size smaller using the Point Size slider makes the data easier to view and interpret.
In the tools section of the viewer, you can measure the distance and angles of features within the pointcloud.
Using the materials section of the viewer, you can use the Select Attributes dropdown to view by intensity, elevation and RGB (if pointcloud is coloured)
UK payment plan
UK payment plan info
USA Payment Plan
Coupling with hardware
Some SLAM software algorithms have been made available as open-source on the internet, but they are purely algorithms and not a product that you can take and use off-the-shelf. SLAM is most successful when it is tightly coupled and designed with specific hardware in mind. A generic SLAM cannot perform as well as one that has been specifically designed for a purpose.
Usage in multi-environments
Visual SLAM is closer to the way humans navigate the world, which is why it’s popular with robotic navigation. But in the same vein, vSLAM will have the same image-capture challenges as humans do, for example not being able to look into direct sunlight, or not having enough contrast between the objects picked up in the image. These can be overcome indoors, however, you may need to map a forest, tunnel or urban canyon. While SLAM technologies don’t rely on remote data (meaning you can scan areas where there is no GPS), you do need to ensure the SLAM technology you chose operate well inside, outside, in daylight and darkness.
Real-time data capture
Mapping a property is time-critical. Ideally, you want to make a single visit and gather sufficient data to create a highly accurate 3D model. Ensure the software you choose transforms 3D point cloud data into actionable information in real-time. This allows you to view and interrogate your data whilst still in the field, and make any adjustments, or collect missed data, then and there.
Flexibility and deployment
If you’re trying to map an enclosed environment (e.g. tunnel, mine) or a complex, difficult-to-access space such as a heritage building with tight stairwells and uneven floors, you need to use fully-mobile, adaptable technology. Wheel-based systems, often used with the vSLAM camera, will struggle with access. Handheld devices or LiDAR scanners that can be attached to a drone or pole and still deliver accurate results in a rugged environment are best for navigating hazardous spaces.
Speed and accuracy
While vSLAM is able to provide a qualitative high-level map and sense of the surrounding features, if you’re needing survey-quality accuracy and rich-feature tracking at a local level, you’ll need to consider LiDAR. Cameras require a high-frame-rate and high processing to reconcile data sources and a potential error in visual SLAM is reprojection error, which is the difference between the perceived location of each setpoint
and the actual setpoint.
Quality and distortion
In order to deliver the depth required for high-quality data, a number of depth-sensing cameras are needed with a strong field of view. In most cases, this isn’t possible, especially as cameras with high processing capabilities typically require larger batteries which weigh down airborne scanners, or limit the time of flight. LiDAR is both faster and more accurate than vSLAM, and can deliver detailed point clouds without expensive (and timely) camera processing.