How mobile LiDAR transformed and expanded a small business

Location
Washington State, USA

Scan time
5-15 minutes per scan

Size
Various interior and exterior sizes

Scanned
A range of large environments
Industry
Surveying
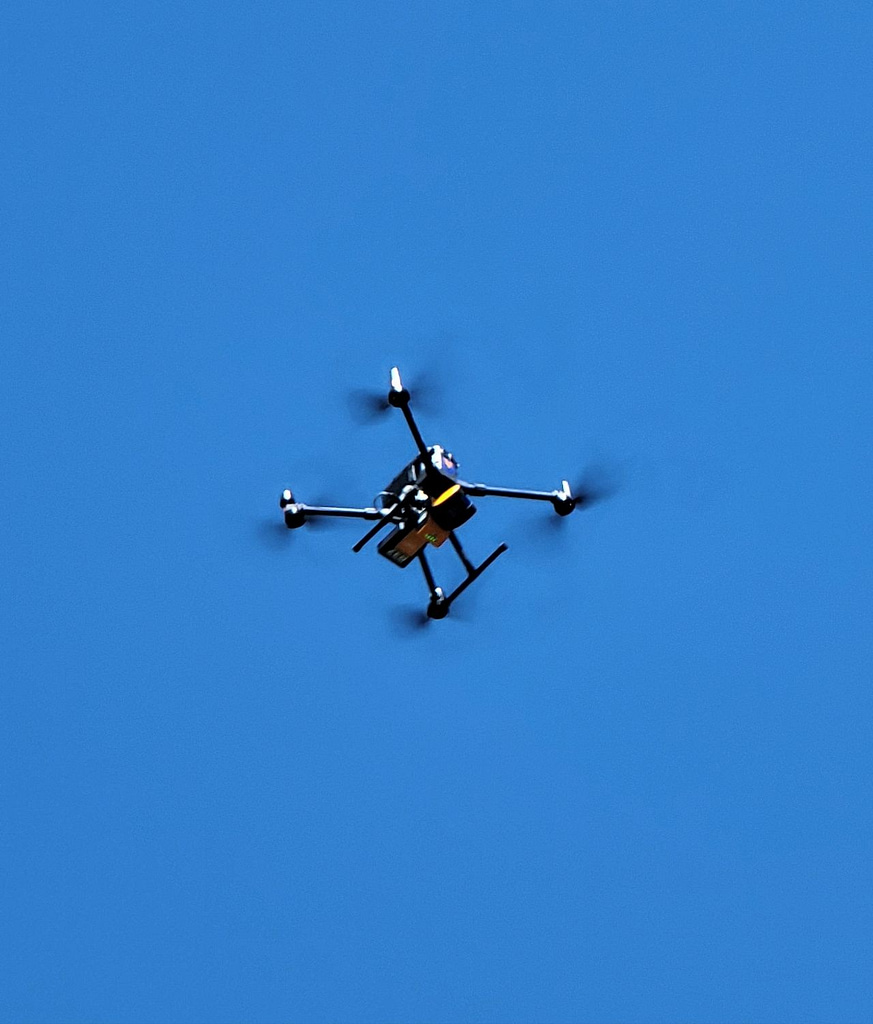
Scout Aerial Solutions is a US-based drone and geospatial service provider. The company helps construction businesses, land surveyors, and engineers capture data faster, provide deliverables efficiently, and increase project productivity. Scout Aerial Solutions use drones, alongside mobile LiDAR, and other Multimedia Collection methods so its clients do not have any informational gaps in their data.
This case study explores the applications Scout Aerial Solutions use mobile LiDAR for and how it benefits data capture and clients’ projects.
Mobile LiDAR’s use in adverse weather conditions
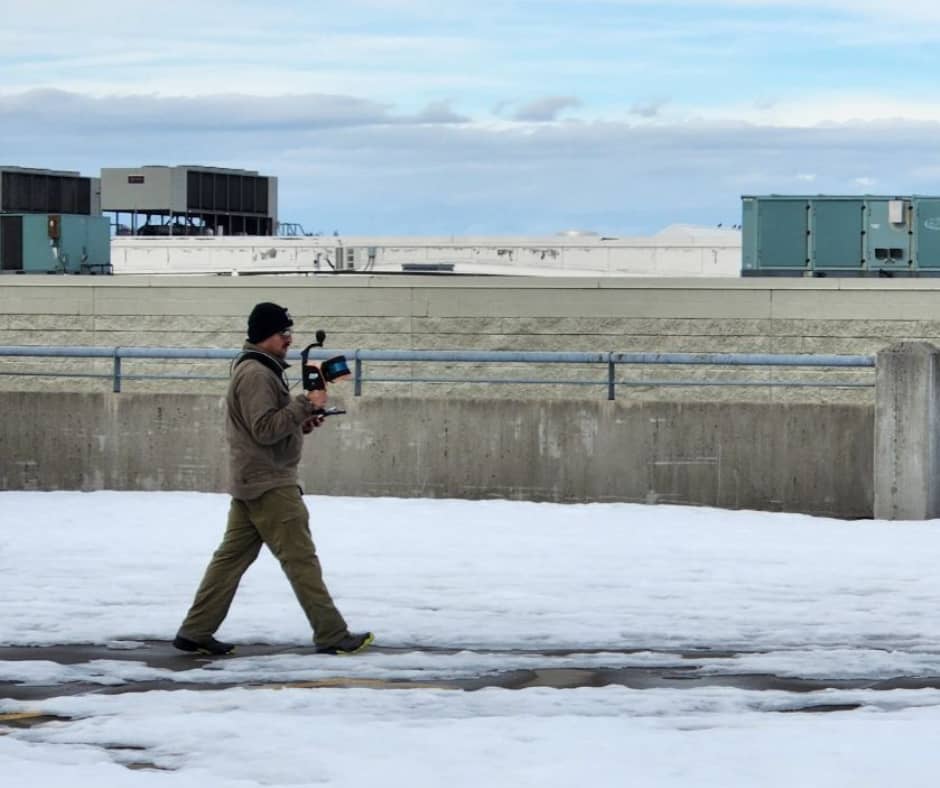
Scout Aerial Solutions is based in Washington State, USA, and primarily used photogrammetry alongside drones as its main data collection method. However, the team have found that during the winter months, adverse weather conditions make scanning from the air more difficult. As a result, they decided to adopt a new data-capturing method, handheld mapping, to use alongside drones.
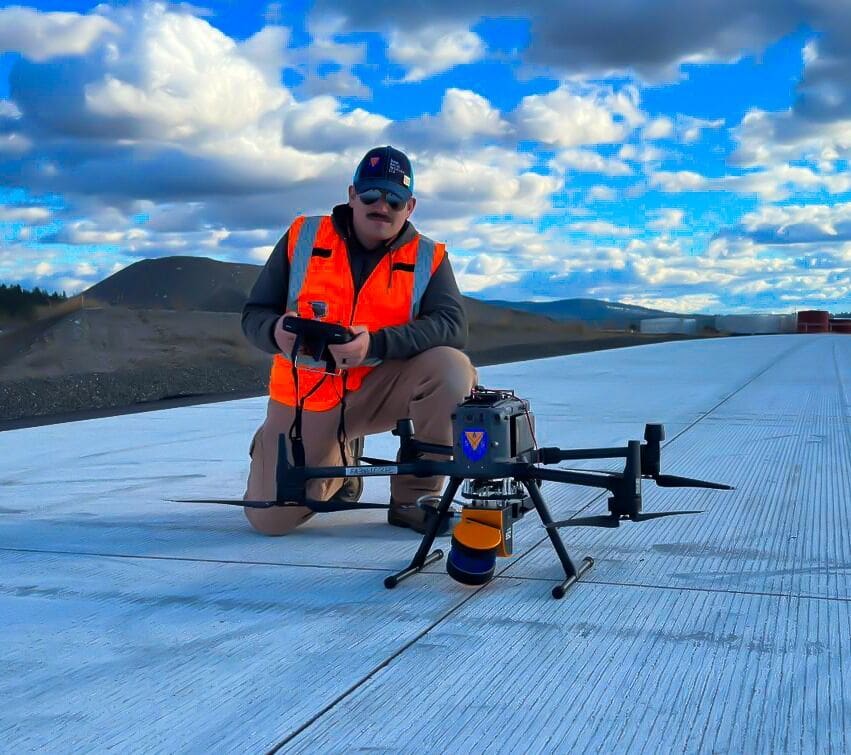
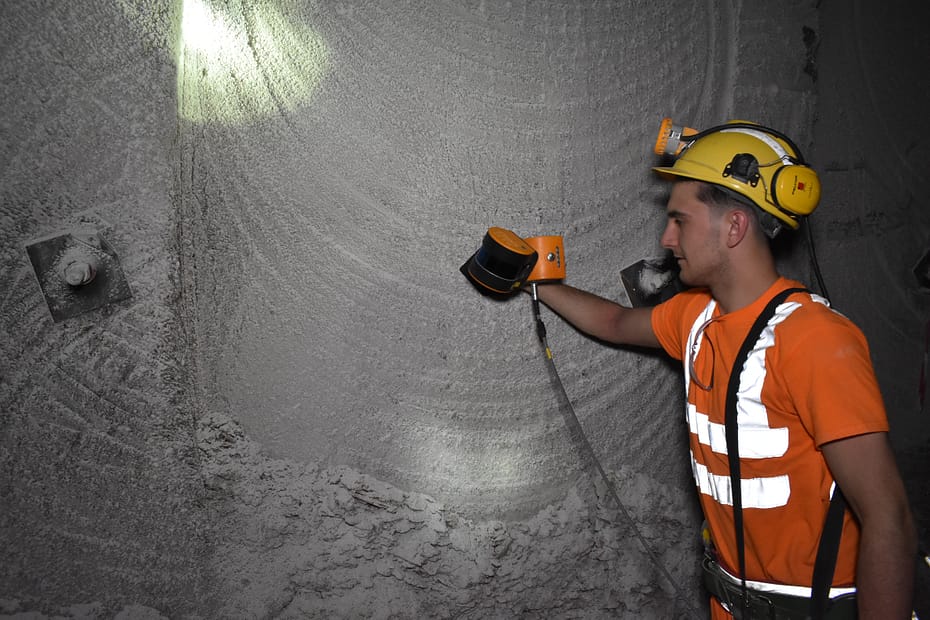
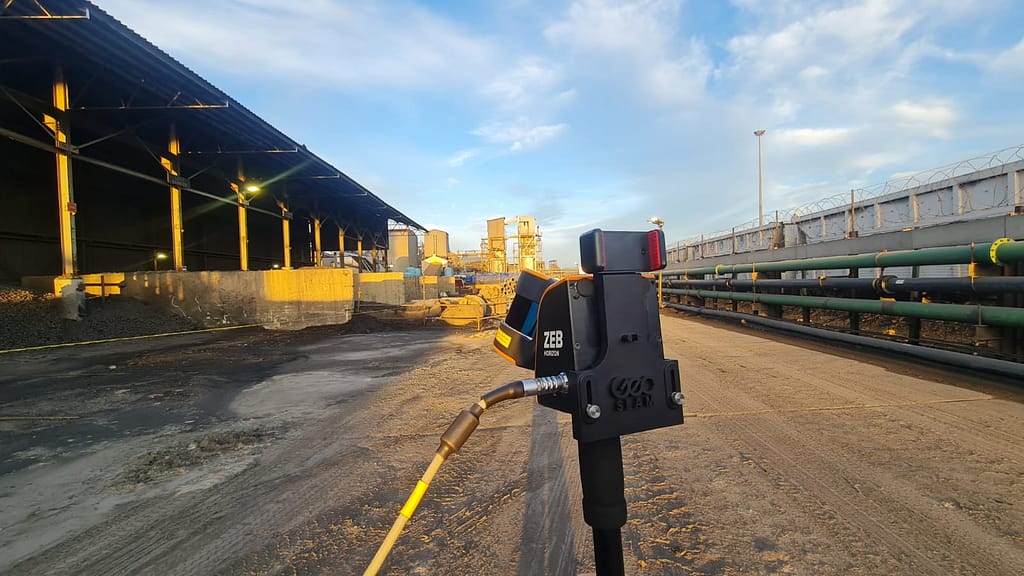
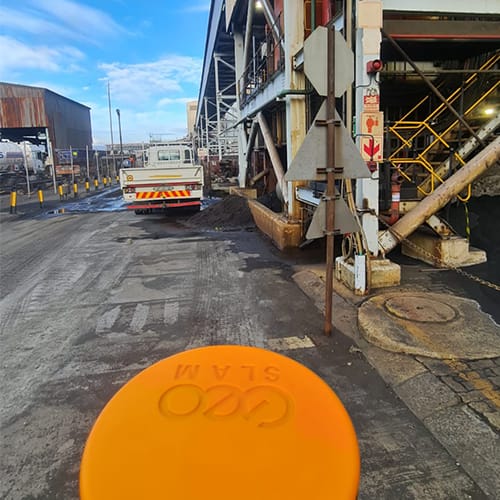
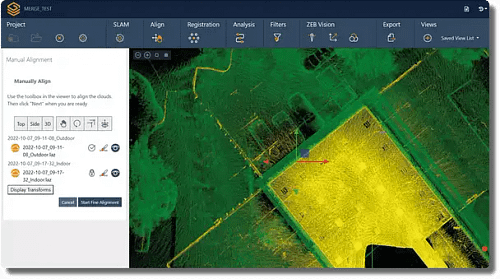
After considering the options, Scout Aerial Solutions opted to work with GeoSLAM’s mobile LiDAR scanners and acquired a ZEB Horizon, alongside the ZEB Vision and Car Mount accessories. Since acquiring the laser scanner, it has proved beneficial for the team and their projects. As an additional collection resource, it allows Scout Aerial Solutions to scan on the ground and inside buildings during the snowy months.
Using the ZEB Horizon for a variety of applications
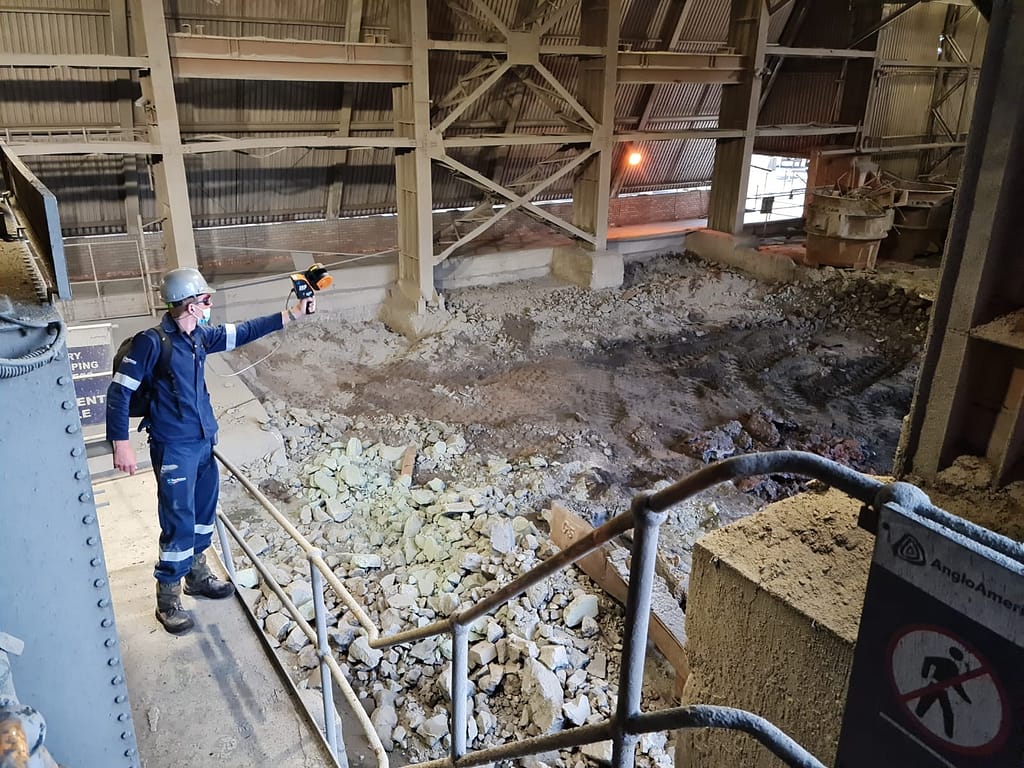
The scanner’s capabilities have continued to impress Scout Aerial Solutions and they now use it for a range of solutions. Over the course of 6 months, the team has completed 72 scans, testing for different applications and customer projects. Each scan, lasting approximately 5-15 minutes, contributes to the growing tally of uses with GeoSLAM’s mobile LiDAR scanner. This includes training with the ZEB Horizon to understand how to best suit the customers’ needs and minimise errors on the job site.
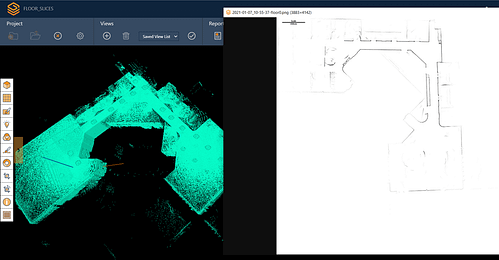
As Scout Aerial Solutions capture data from interior and exterior environments the size of scans varies from project to project. However, the largest area they have scanned internally is a 400,000 sq/ft parking garage and externally, around 68 acres, captured with a drone.
How Scout Aerial Solutions use mobile LiDAR
Additionally, Scout Aerial Solutions provide testing, training, and demos to its clients demonstrating the potential of handheld laser scanners.
University of Idaho: Centre for Forest Nursery and Seedling Research
The biggest project that Scout Aerial Solutions are working on is collaborating with one of its clients to scan forestry nurseries, using the ZEB Horizon. The aim of this scan is to be able to scan forest plots more easily to measure sapling growth and ID trees on site.
Although Scout Aerial Solutions is a company initially set up to service the AEC sector, mobile LiDAR has proven to be an asset in other sectors, helping them to branch out into forestry.
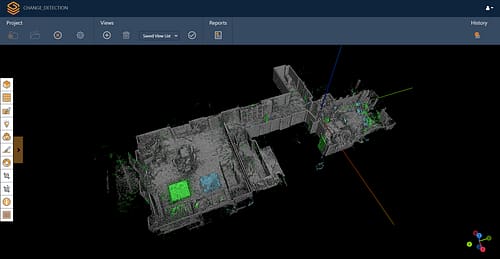
Camber detection
Scout Aerial Solutions carried out a scan using mobile LiDAR for a company that needed to detect the camber of concrete beams over several thousand sq. ft. Previously, the only data collection method available to the company was a total station, alongside already existing model calculations from before a floor pour. However, they wanted to evaluate whether mobile LiDAR can more effectively measure the beams. With the ZEB Horizon, Scout Aerial Solutions proved to their client that mobile LiDAR is a more efficient method of data capture.
Scout Aerial Solution’s growing use of mobile LiDAR
Scout Aerial Solutions are continuing to introduce mobile LiDAR to its clients, including in the environmental and archaeological sectors, that have produced very promising results.
Furthermore, the company has found that GeoSLAM Draw is beneficial for its construction clients as it is possible for clients to integrate deliverables into regularly used third-party software, such as Bluebeam, via an array of export options.
As Scout Aerial Solutions use mobile LiDAR more and discover the full capacity of the ZEB Horizon and accessories, their productivity and client fulfilment will also increase. The ZEB Horizon is designed with accessories in mind, which means adding required accessories to the scanner for future uses is cost-effective. Additionally, unlike other methods of capture which might demand several units, the ZEB Horizon has the capability to be an all-in-one solution.
Scout Aerial Solutions are currently trialing usage of the new carry-case backpack to see how it will benefit their projects.