Here’s some helpful tips for the best viewing experience
Klagenfurt Cathedral
Location: Austria
ZEB Scanner: ZEB Horizon
Scan time: 18 Minutes
Would you like to see a specific dataset that’s not on this page? Contact [email protected]
Location: Austria
ZEB Scanner: ZEB Horizon
Scan time: 18 Minutes
Would you like to see a specific dataset that’s not on this page? Contact [email protected]
In this Chartered Institution of Civil Engineering Surveyors article, Dr Neil Slatcher talks all things SLAM, answering questions such as ‘What’s the difference between SLAM and traditional laser scanning?’ and ‘What kind of SLAM types are there?’.

Savoie Region, France

2 hours

3000 sq/m

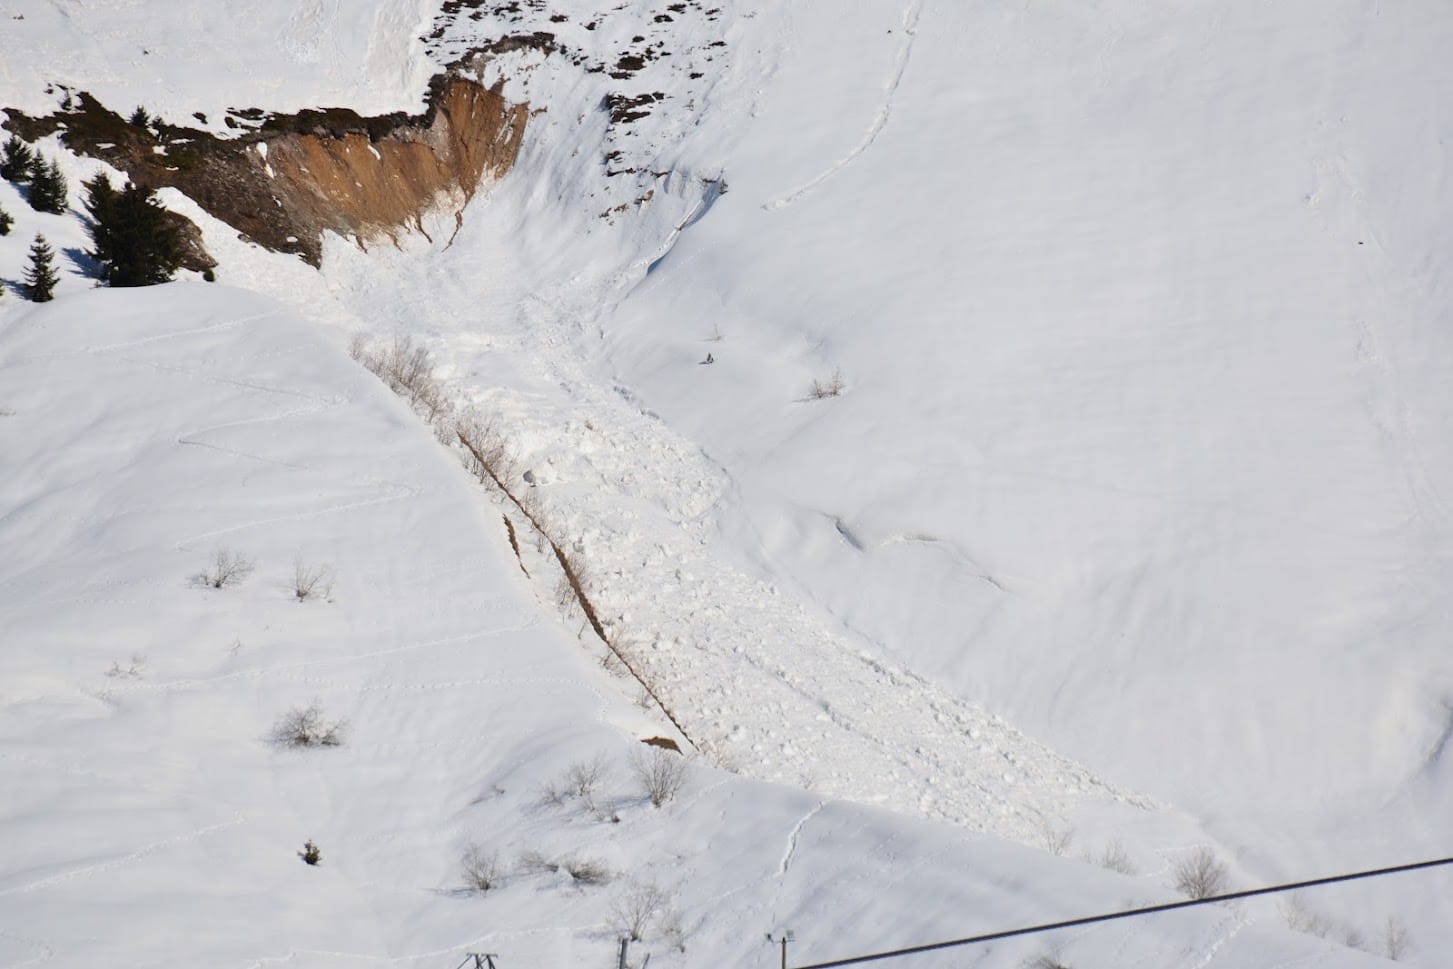
Avalanches and Snowpacks

Education
Climate Change is often attributed to greenhouse gases, however, there are also other factors that affect the Earth’s climate. One example of this is the ‘Earth’s radiation budget’. Earth’s radiation budget is energy that enters the earth’s atmosphere that is reflected, absorbed, or emitted by our planet. If the budget becomes out of balance, it can cause temperature increases or decreases in the Earth’s atmosphere.
A team from the Institut de Physique du Globe de Paris (IPGP), a world-renowned geosciences organisation, have conducted research in this field. Their research focuses on how differences in surface roughness effect the amount of microwave radiation picked up by satellites.
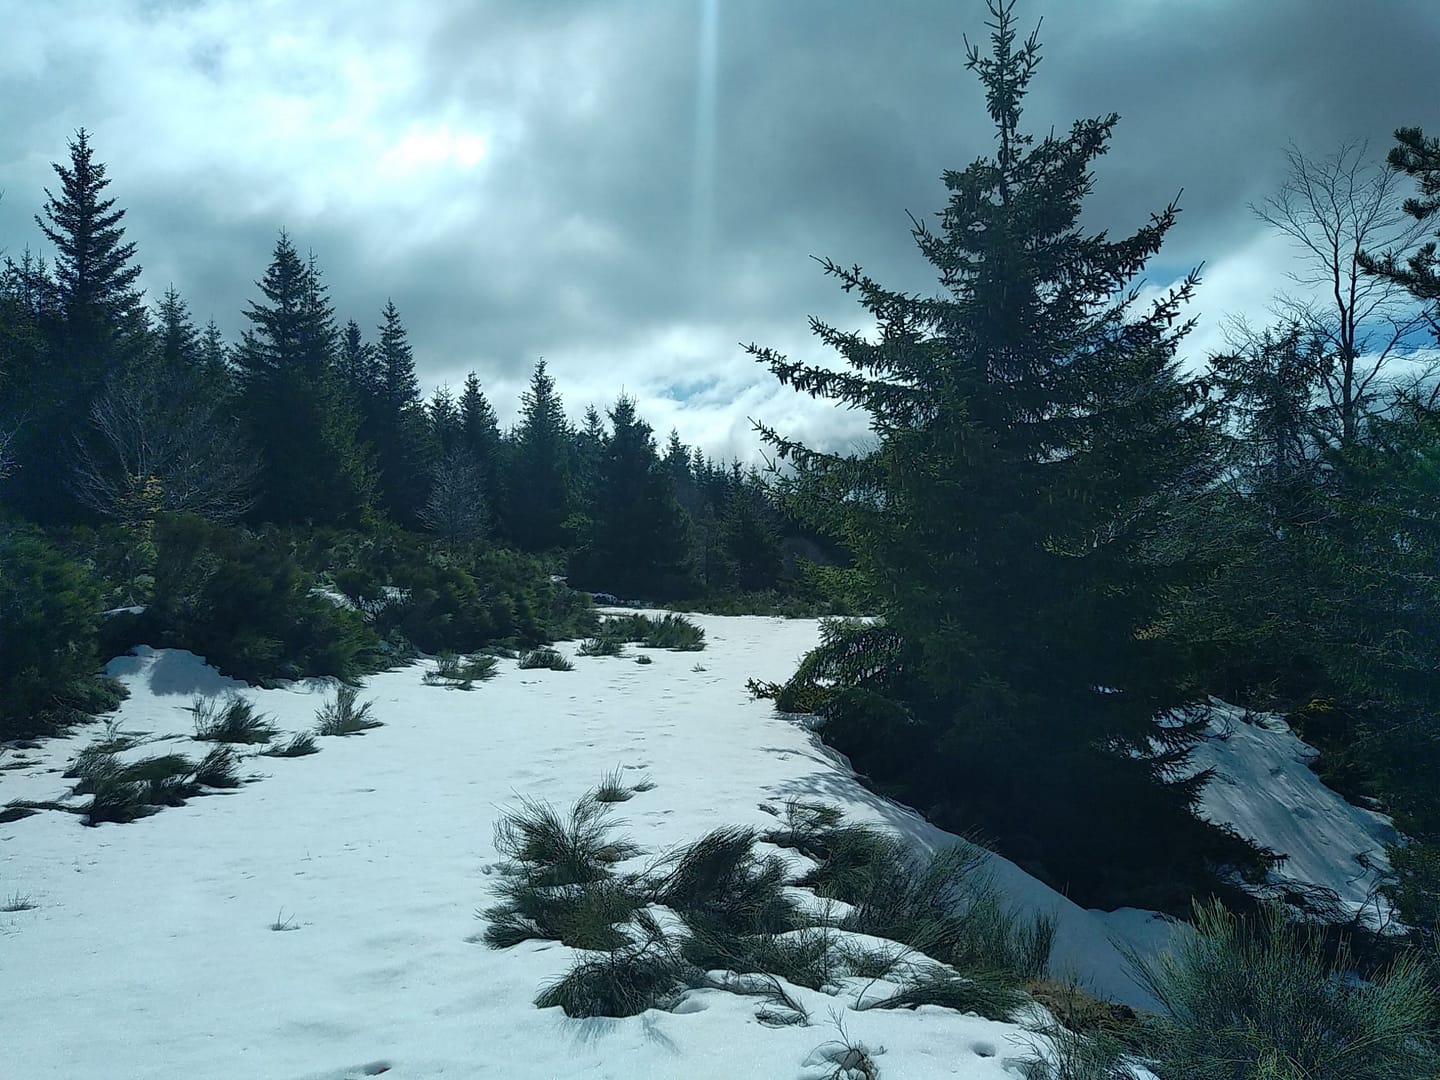
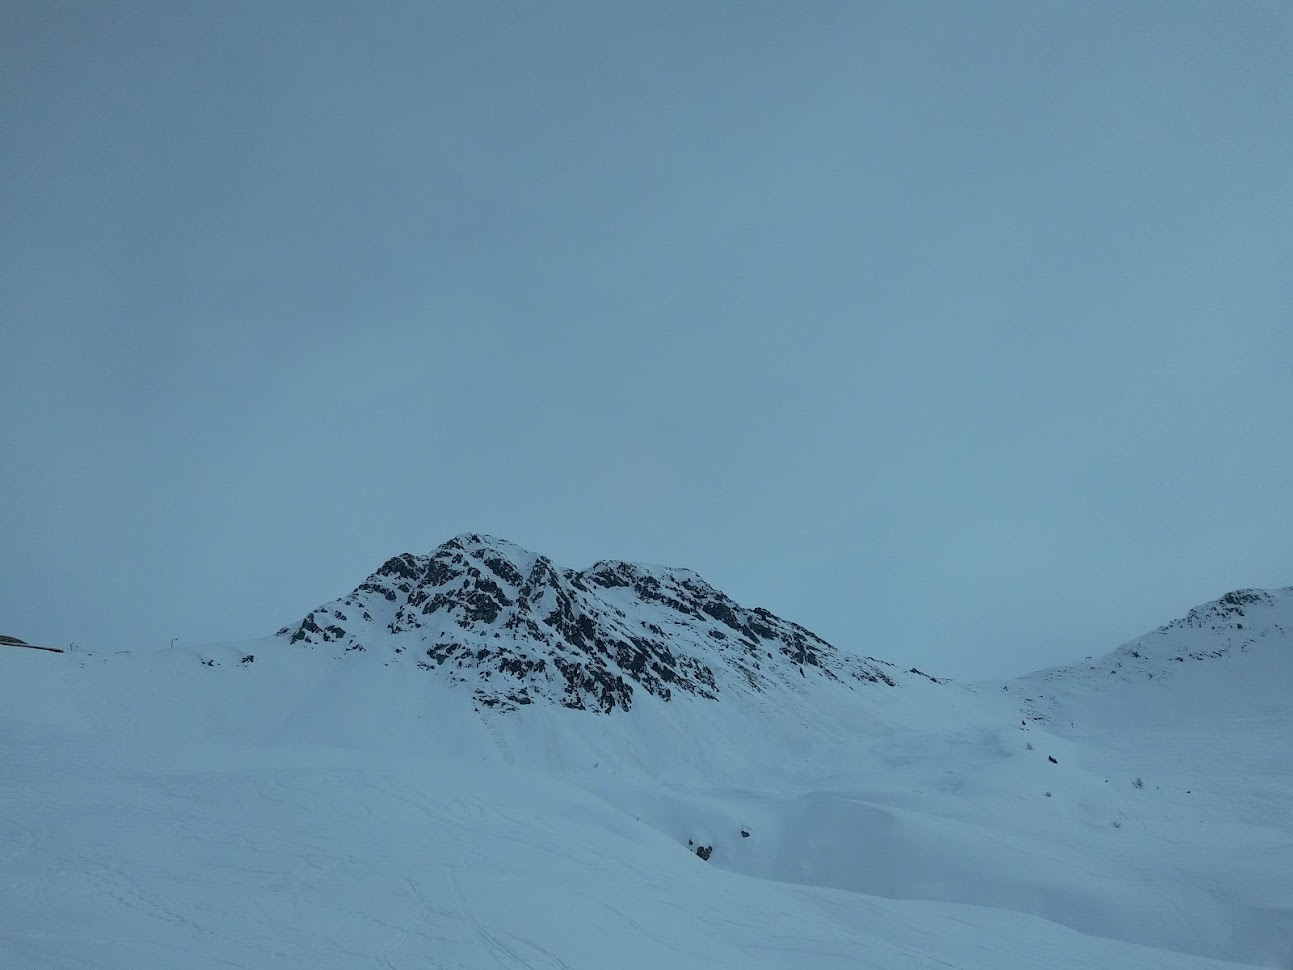
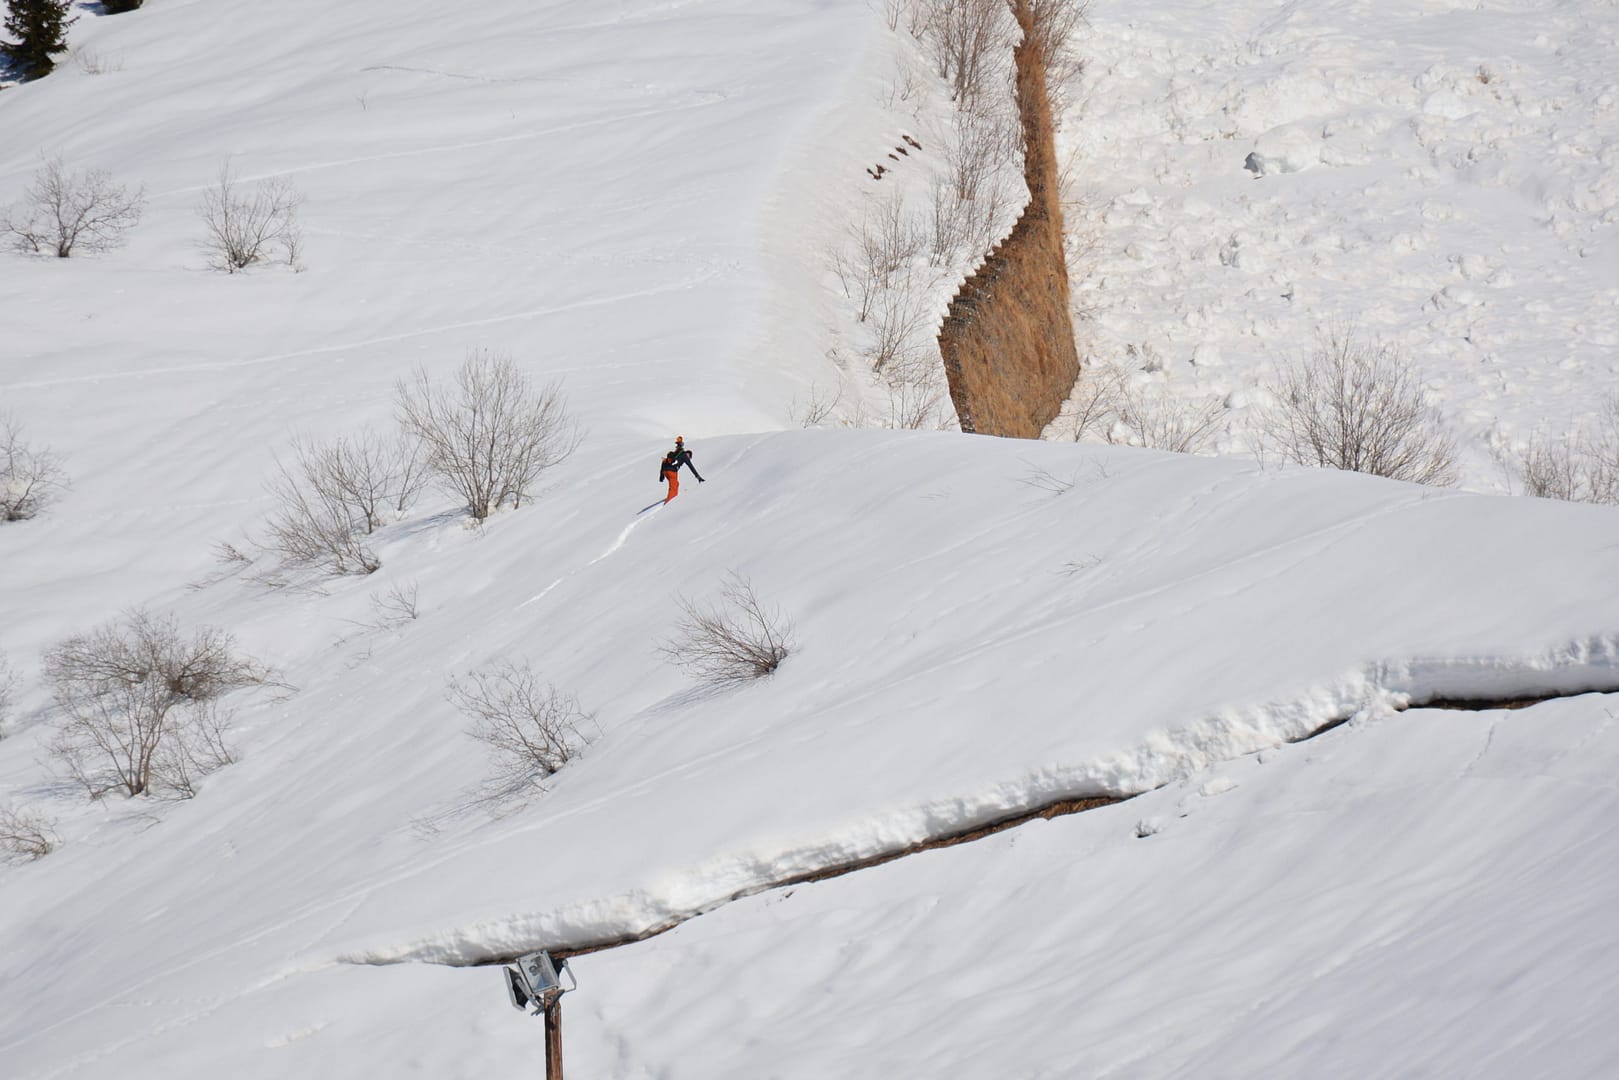
For their research, the team have been concentrating on snowpacks and avalanches in the Vanoise Massif Mountain range. They aim to compare the two satellite observations to assess the effect of the change in roughness when avalanches form using radiative transfer modeling. This is the process that measures radiation from the Sun into and out of the Earth. High levels of sun radiation can cause snow to melt which, in turn, can cause avalanches.
The Vanoise Massif Mountain range is in the Granian Alps, in the Savoie region of France. It is the third highest massif in France, sitting at 3,885 meters at the summit Grande Casse. The range is the location of France’s first National Park, the Vanoise National Park.
To collect data from the snowpacks and avalanches, the team needed an accurate 3D model of the area. Vanoise National Park is a no-fly zone which meant that UAVs were not an option. Additionally, the team did not want to spend extended periods of time on the mountain due to the risk of avalanches. This ruled out more time-consuming methods of scanning, like terrestrial laser scanners.
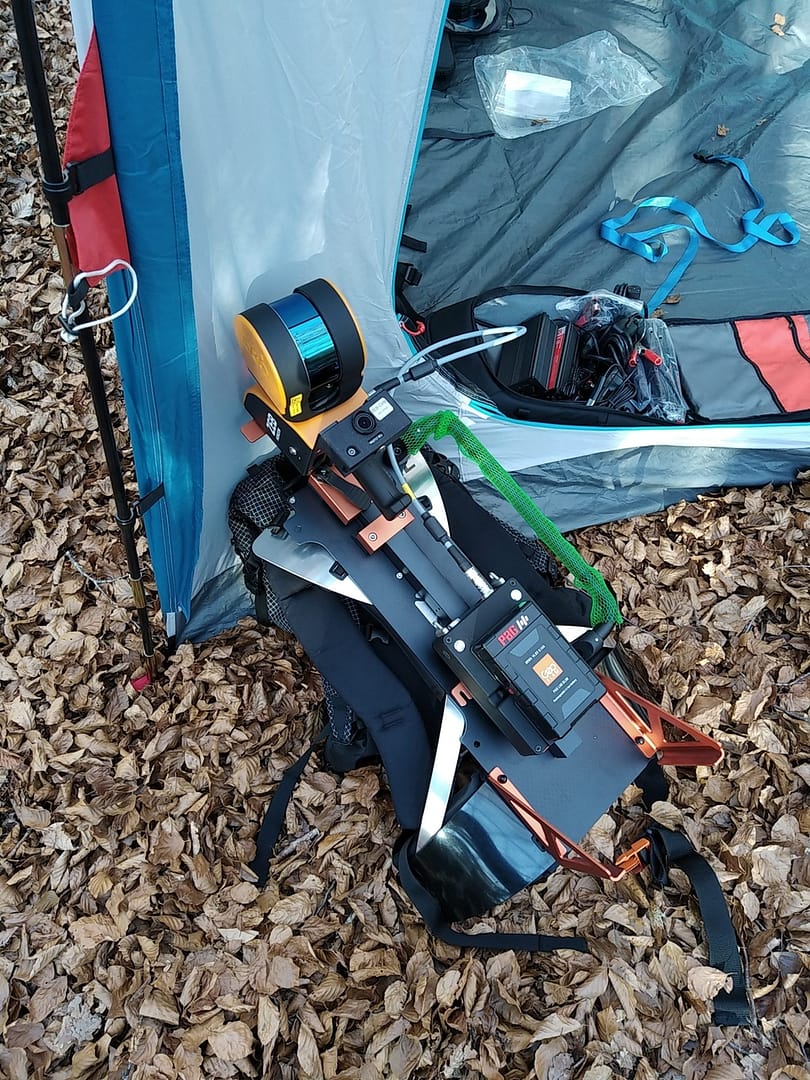
As a result, the team needed a more efficient way of mapping the difficult area. They decided SLAM was their best option and chose to use GeoSLAM’s ZEB Horizon with the backpack solution.
We were looking for a portable, versatile and affordable LiDAR scanner solution and GeoSLAM allows us to meet all our constraints.
The walk and scan method and versatility of the ZEB Horizon stood out to the team from IPGP. The specificity of the environment meant they needed to use technology that was easily movable and durable. In addition, the backpack solution was essential because it meant that the person carrying out the scan had their hands free to help them navigate the rough terrain.
Furthermore, the ZEB Horizon’s speed of capture meant the team were able to scan the 3000 sq/m area in approximately 2 hours. This ensured that they did not spend too long in the hazardous mountain range, whilst capturing the accurate data they needed.
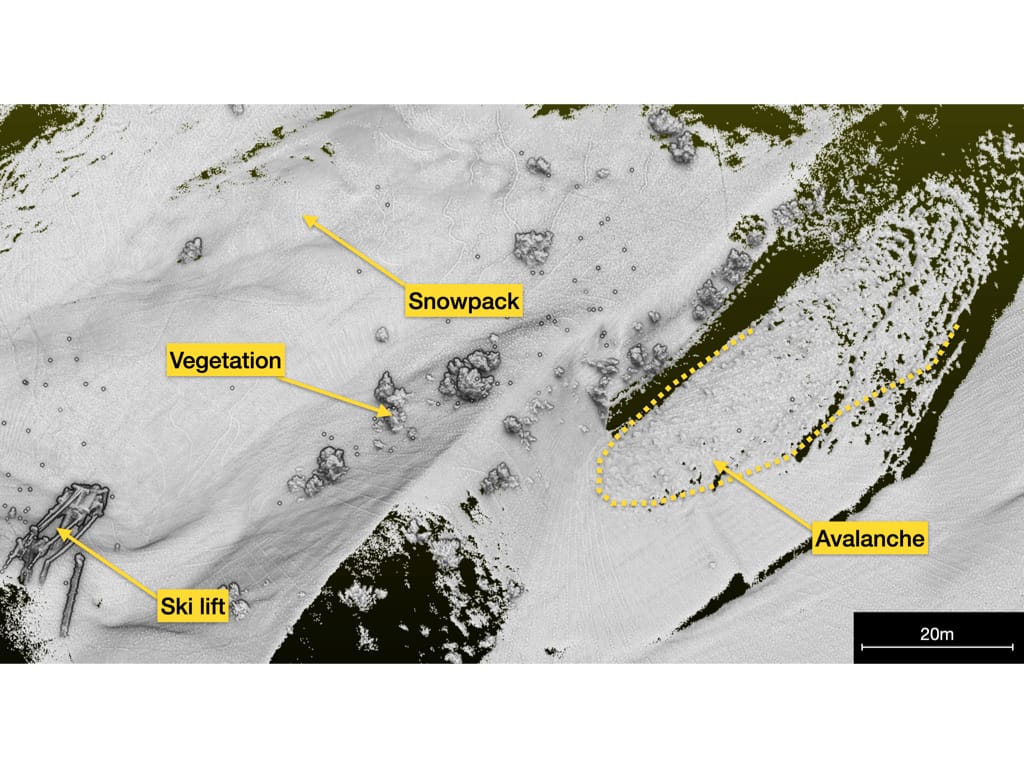
The scan was processed using GeoSLAM’s software package. The resulting point cloud is being integrated in IPGP’s research analysis and modelling.
The ZEB Horizon’s ease of use and accuracy means the scan data can be compared with the data collected from the satellite observations. This is known as ground truth analysis and helps with clarity within the research. The scan data also aids with data calibration which allows for atmospheric effects and obstructions to be considered when analysing the final data.
The positive outcome of the data has encouraged the Institut de Physique du Globe de Paris to plan additional surveys in this area.
Monitoring environmental changes are just one of the ways GeoSLAM customers are using their mobile mapping devices, alongside more common everyday uses like measuring buildings or construction sites.
Thanks to the team at Institut de Physique du Globe de Paris for sharing their story with us.
If you’d like to learn more about how GeoSLAM solutions can help you, submit the form below.
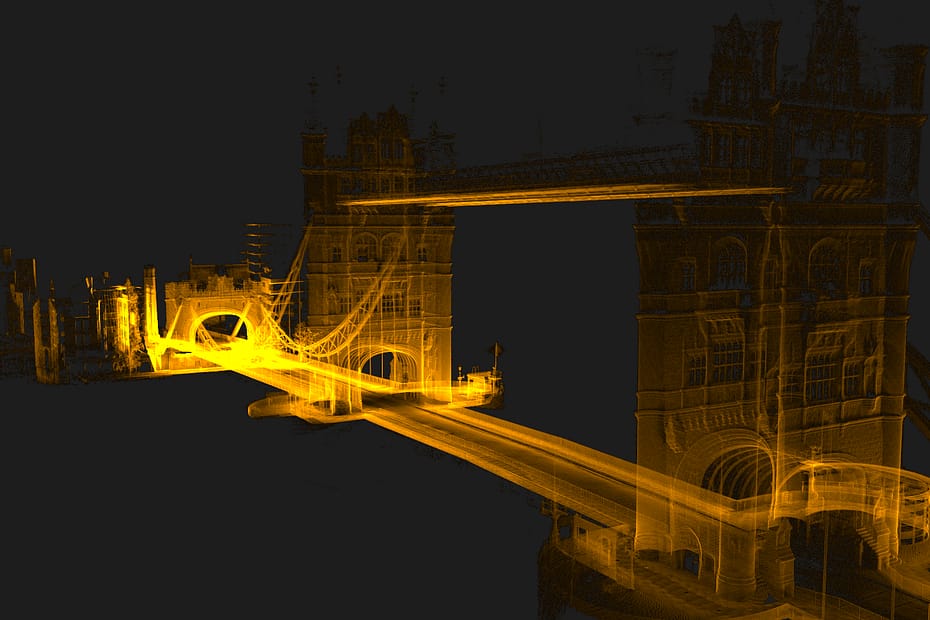
Last Updated on 6th June 2022 This Jubilee Weekend, See 5 London… Read More »5 London Landmarks As You’ve Never Seen Them Before
Location: Europe
ZEB Scanner: ZEB Horizon/ ZEB Discovery
Scan time: 15 Minutes
Colourised data was captured using the ZEB Discovery backpack solution.
Would you like to see a specific dataset that’s not on this page? Contact [email protected]
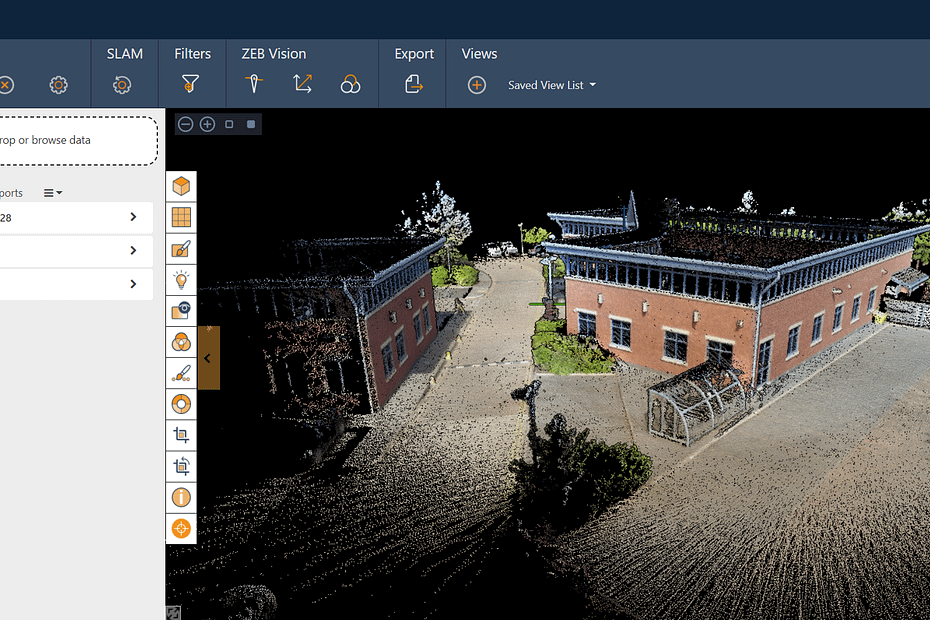
With ever-increasing research and development in the technology, the advances in both scanning hardware and processing software are improving the detail, scale and use of point cloud data. One of these improvements is colourisation. Adding colour has plenty of benefits when viewing and analysing point cloud data.
Location: United Kingdom
ZEB Scanner: ZEB Horizon
Scan time: 5 Minutes
Colourised data was captured using the ZEB Vision camera accessory.
Would you like to see a specific dataset that’s not on this page? Contact [email protected]
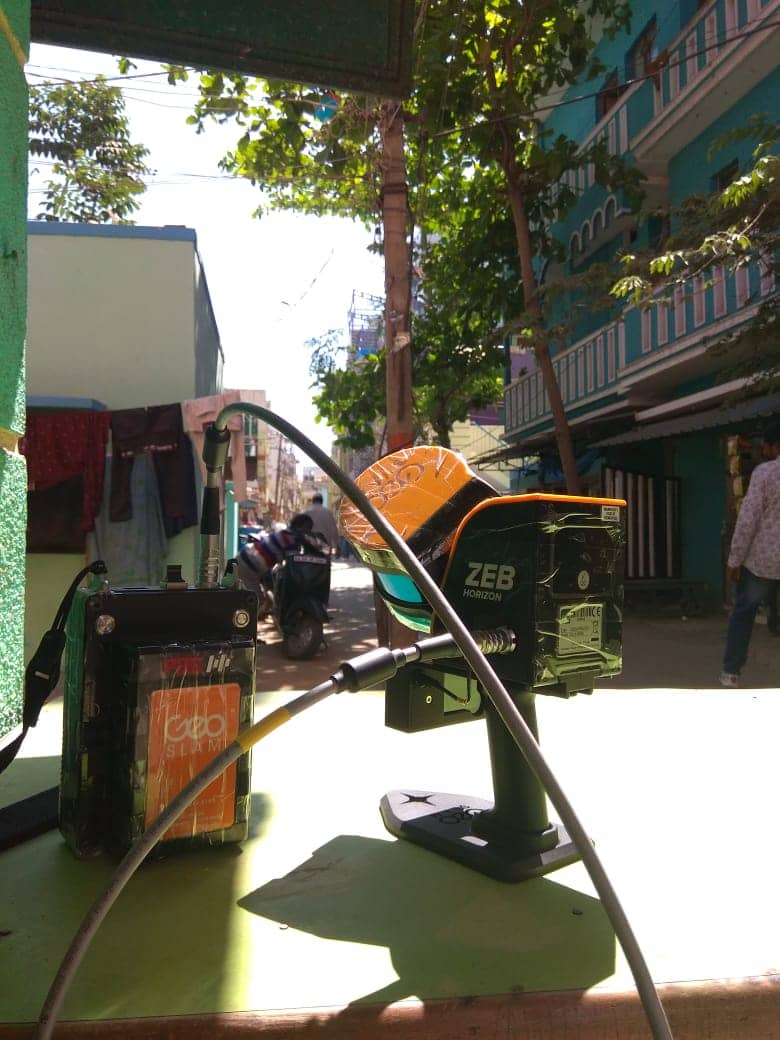
Bengaluru, India
25-27 minutes per scan
40 acres
Informal Settlements
Surveying
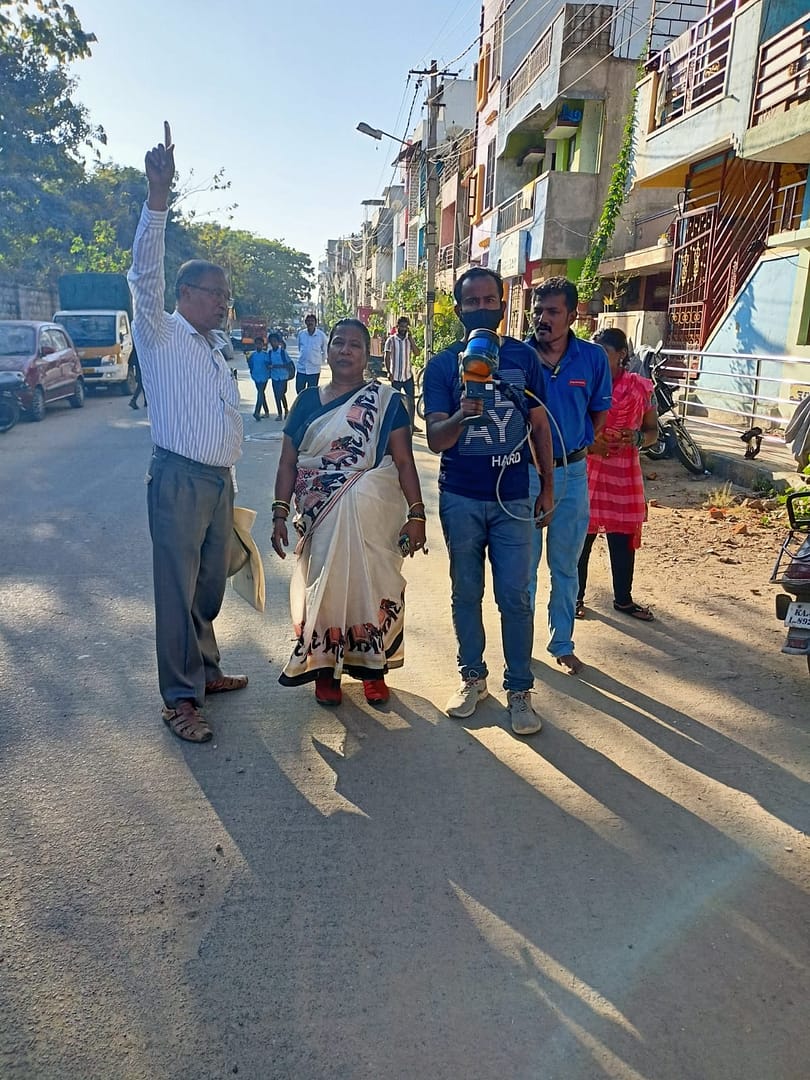
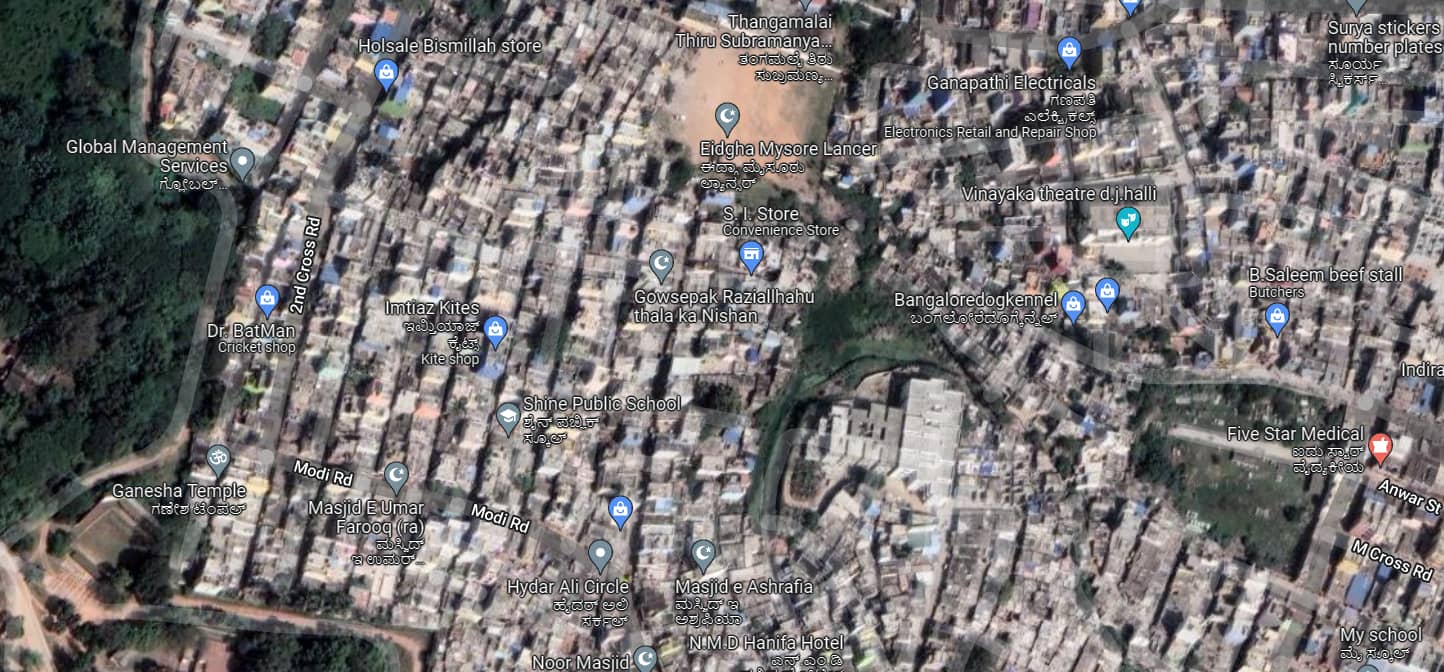
The informal settlements in Bengaluru, India, house roughly 16% of the city’s population and there are around 500 recognised in this area.
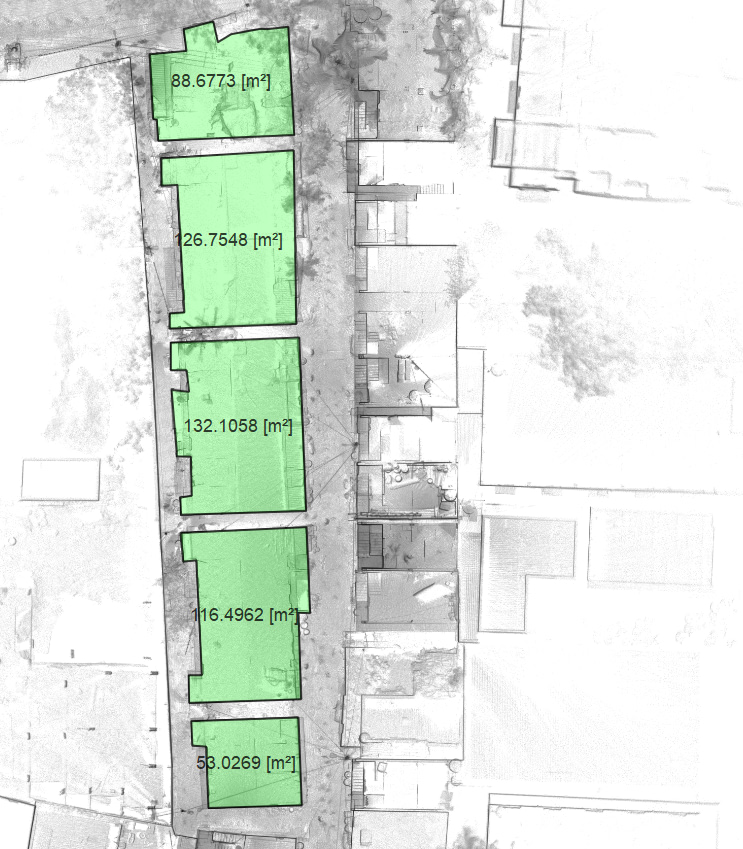
Currently, Bengaluru is going through a period of modernisation and urbanisation which has caused the city limits to expand. As a result, the local government must provide documents of every house, detailing accurate measurements of its structure, such as boundary lines and roof heights.
The government has plans to formally declare ownership of the settlements to the people living in them, which means a map of the whole area was needed.
A team from a reputed geospatial company appointed by government, surveyed the area and collected this data. This involved mapping the informal settlements in Bengaluru with their complex layouts. The task was challenging as they include many narrow lanes that are difficult to access. Additionally, people were going about their daily activities.
Furthermore, some parts of the settlements are in dark and cramped areas whereas others are in direct sunlight. Consequently, the team needed to find adaptable solutions and technology that could handle these difficult environments, as well as deliver on the task in hand.
The area in question is a no-fly zone, which meant that drones were not an option. However, other methods for capturing data such as static scanning wouldn’t be feasible because of the busyness of the area. The cramped streets also meant the team would struggle to use a backpack solution either.
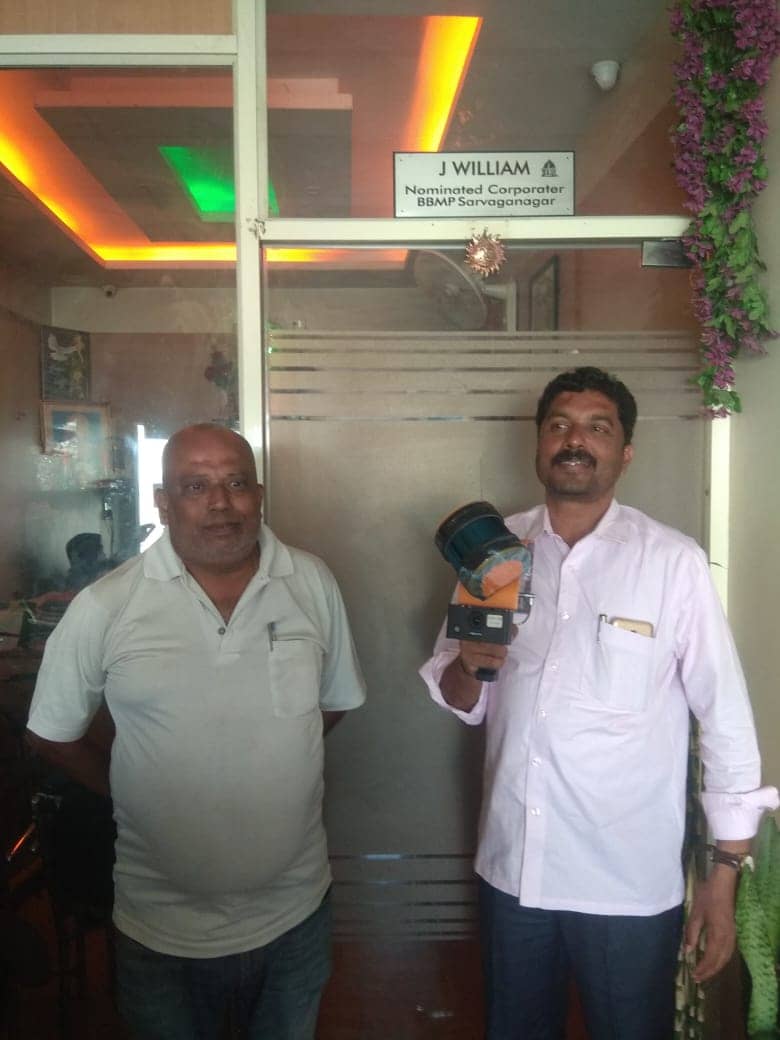
A fast and effective way to map the informal settlements was to walk through the complex passages, and a handheld laser scanner was the most suitable option. The geospatial company chose GeoSLAM’s ZEB Horizon scanner, due to its quick method of capturing accurate data and ease of use. The lightweight solution means that only one person is required to scan an area at any one time. This is less disruptive to the surveying team, which in turn is cost effective for them and their client.
The extensive maze of restricted passages and dead ends did not affect the versatile SLAM technology. By using the ZEB Horizon, the team were able to scan 40-45 different areas of the settlements. The team captured smaller areas of the informal settlements in a single scan ranging from 25-27 minutes. The team mapped larger areas over multiple scans, sending them to the client individually.
The ZEB Horizon provided good quality data and allowed us to scan difficult to access areas accurately and efficiently.
The final scans were imported into GeoSLAM Draw where orthophotos were automatically created. As a result, the engineers could make accurate measurements in a timely manner. In addition, the point clouds were exported to Terra Solid, where further information was extracted for the final report.
The final data delivered on their client’s accuracy goals. They were able to smoothly extract the boundaries and roofs of every single house in the informal settlements.
This is not the first time that GeoSLAM technology has been used to map informal settlements in India. The ZEB Revo was used to accurately scan the settlements of Mumbai in 2017. The resulting 3D point cloud helped to extract information about the elevations and sections of each house frontage.
If you’d like to learn more about how GeoSLAM solutions can help you, submit the form below.
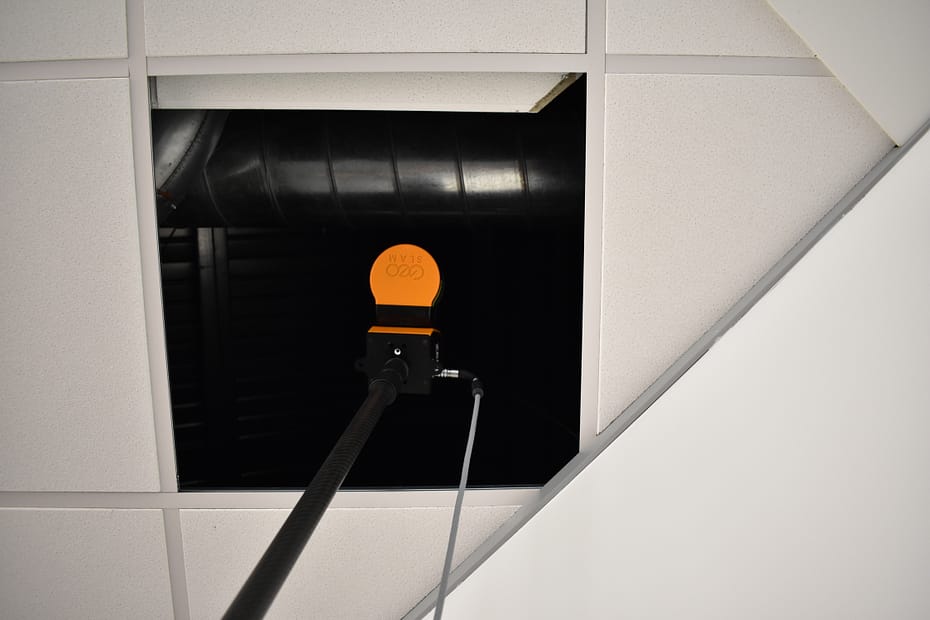
Surveying buildings is difficult and accessing hard to reach areas, like dropped ceiling or raised floors, without disrupting business can be seemingly impossible. In this blog we’ll discuss how SLAM and LiDAR technology has made scanning behind dropped ceilings a simple process.
Location: Peak District, UK
ZEB Scanner: ZEB Horizon
Scan time: 27 Minutes
This data was captured as part of the Big SLAM Tour of the UK, read about it here.
Would you like to see a specific dataset that’s not on this page? Contact [email protected]
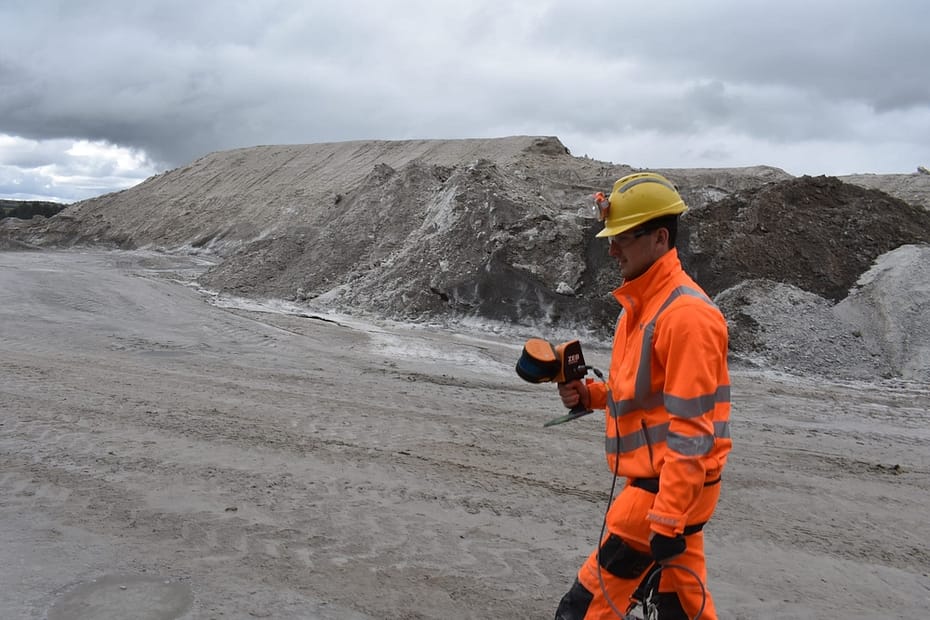
Boulby mine was one of the first in the world to use SLAM technology, having adopted GeoSLAM’s ZEB1 into their workflow, in 2013. Nowadays, the mine operates GeoSLAM ZEB Horizons for most of their survey needs.
Boston, USA
Approx. 20 minutes per scan
Over 1 million sq/ft
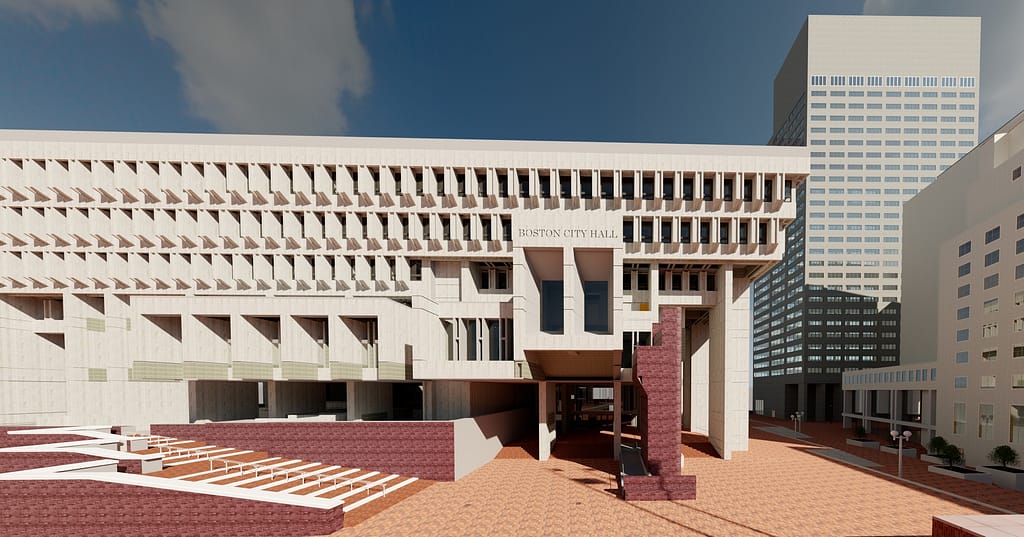
Boston City Hall
Surveying
Mapping an Iconic Landmark
Boston City Hall was built in 1968, to help boost the city’s economy after years of stagnation. The building and surrounding plaza sought to modernize the city’s urban centre, reinvigorating the run-down neighbourhood of Scollay Square.
Despite the public investment project being welcomed by the people of Boston, the buildings ‘brutalist’ style of architecture created debate amongst the locals, with some suggesting you either love or hate the concrete design. In spite of the concerns from the public, the city
hall has been home to the mayor of Boston and the city council for over 5 decades, and the ‘brutal’ style of architecture has become part of Boston’s rich history.
To encourage more people to use Boston City Hall and to increase accessibility, it was decided in 2017 that the City Hall would be renovated to serve a more modernized purpose. The infrastructure upgrades include better access to utilities, plants and fountains in the plaza area, with the intention of encouraging more people to visit.
The Horizon was a gamechanger…it’s just amazing in terms of the scanning distance, power of the sensor and the ability to easily capture the entire plaza.
Peter Garran and his team, from Aerial Genomics, were appointed by The City of Boston and Sasaki with the task of scanning both the interior and exterior of the City Hall, in anticipation of the renovation project. Spanning 9 floors and housing multiple individual rooms, as well as a busy plaza area, the task of mapping the building threatened to take several months to complete. Also, the City Hall is an active office that contains confidential rooms and Aerial Genomics did not want to disrupt everyday operations too much. Considering their options, the team decided the fastest and most cost-effective way of mapping the building and its surrounding area would be to use mobile LiDAR scanners.
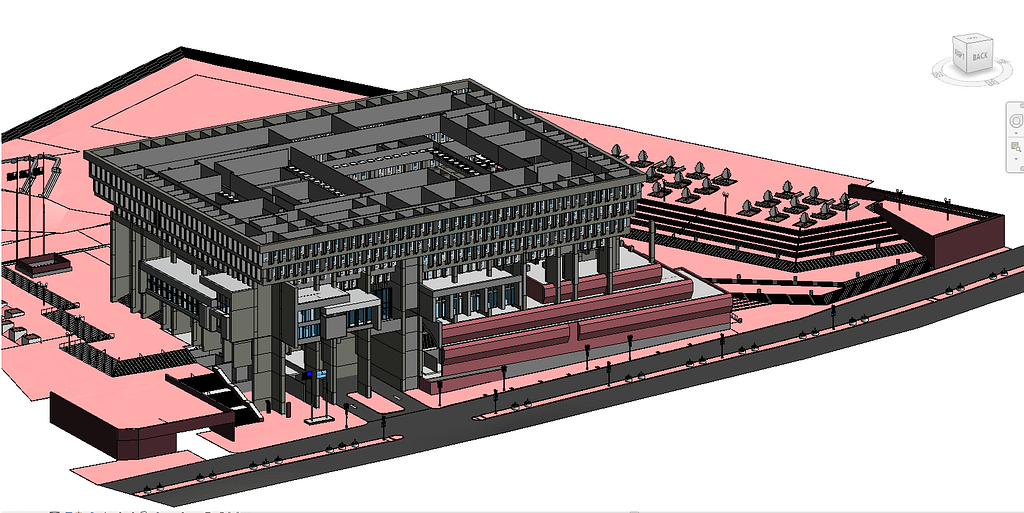

They chose a ZEB Horizon to scan the exterior and inside the Main Hall. The ZEB Revo RT was used to map the buildings vast interior. These scanners were chosen due to their speed, accuracy and mobility. By simply walking around the building, Peter and his team captured the large layout, saving them time.
As they were scanning during the pandemic, it was key for Peter and his team to spend as little time as possible in the building and compared to other scanning methods, GeoSLAM’s scanners were able to deliver on that goal. With the ZEB Horizon, Aerial Genomics captured both the exterior and interior of the Main Hall in just 4 scans, and in less than 2 hours. This scanner was specifically chosen to scan the Main Hall due to its 100m range being able to capture the high walls. To help combat getting in the way of the City Halls’ day-to-day business, the team were given limited amounts of time in the evening to scan a multitude of rooms inside the Hall. Using the ZEB Revo RT, the team could scan the almost 1 million square feet interior, in just 4 nights, consisting of 5 hours each night.
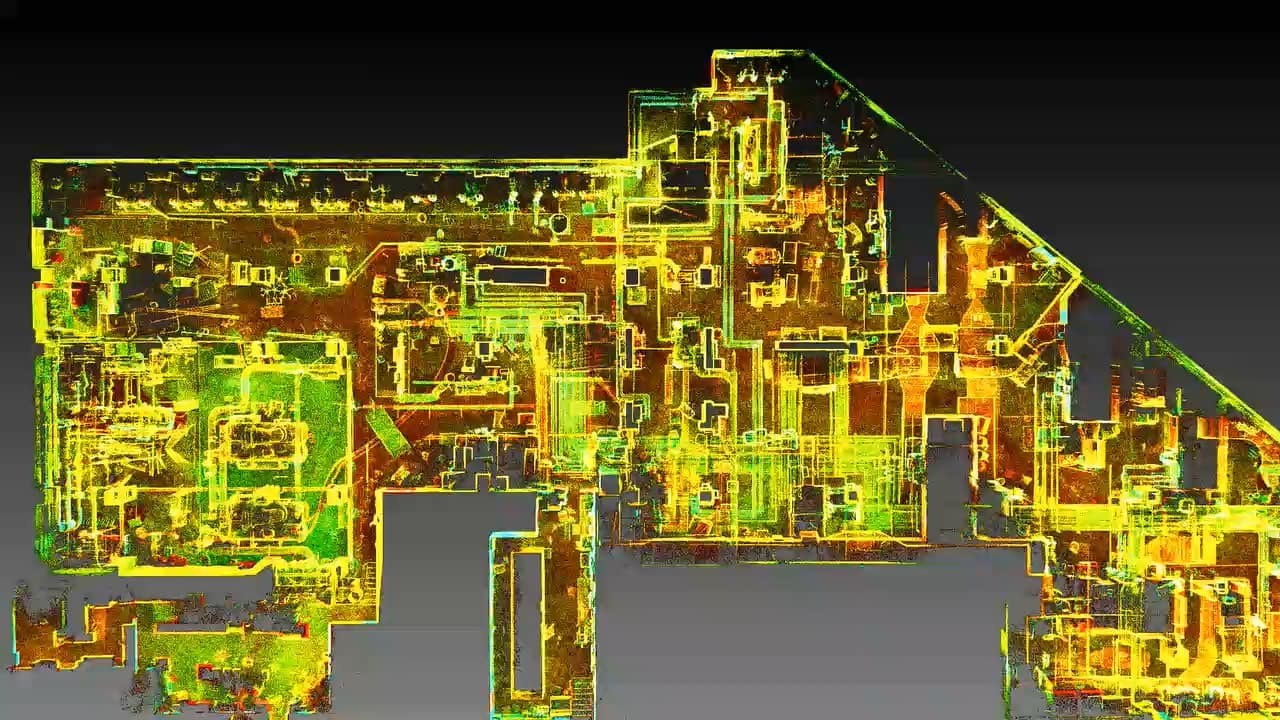
The scans were processed using GeoSLAM Hub and merged to create one point cloud, by Aerial Genomics. The manoeuvrability, ease of use and accuracy that the ZEB scanners provided meant the data collected was ready within a week, to be created as a BIM model to send to the architects. The simple, easy to use solution meant the architects could start thinking about the redevelopment and renovation, without the need to visit the hall during a pandemic. The final BIM model, created in Autodesk Revit, is still referred to today.
If you’d like to learn more about how GeoSLAM solutions can help you, submit the form below.

Known control points are captured during a scan and automatically compared and matched to the associated coordinates during the processing stage in Connect. A rigid and/or a non-rigid adjustment can be made to the dataset and an accuracy report is exported, highlighting how successful the transformation was. Users can now view and manipulate the processing parameters to ensure a more accurate match between points.
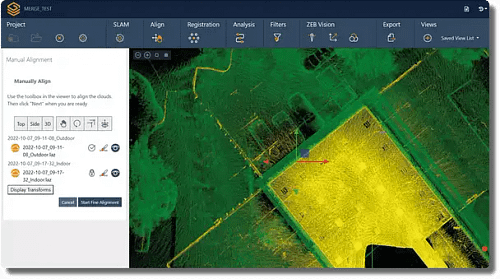
Align multiple scans using a combination of manual and automatic processes. This workflow can be performed on two or more scans in the same project. Users have a choice to export the aligned scans separately or as a single merged point cloud.

Common data capture scenarios, such as UAV, outdoor, indoor, linear, and vehicle, have been characterised in Connect and data processing pre-sets for each environment have been defined. These can be selected at the beginning of the data processing stage allowing this process to be highly simplified.

Both methods match the scan data from a ZEB Locate system with the GPS data collected from the antenna to georeference the point cloud. When a scan starts and ends in the same place, this is classed as “closed loop”. “Open loop” is when the start and end position of a scan are in different locations. Standard SLAM practices apply to both methods of data collection.
Open Loop SLAM for the ZEB Locate is available on request – let’s talk about it.

Common static points are captured during several scans meaning that these datasets can be automatically aligned. A single point cloud is then exported as if the data was captured in a single scan.
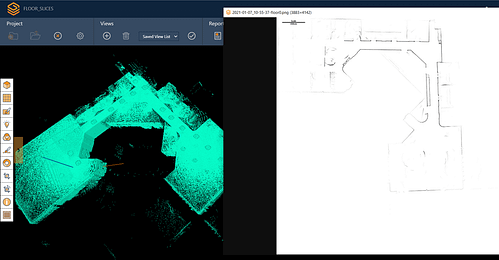
Horizontal and vertical slices can be taken from any location within the point cloud. Horizontal floor slices can also be automatically taken at a given height above the floor as defined in the processing stage.
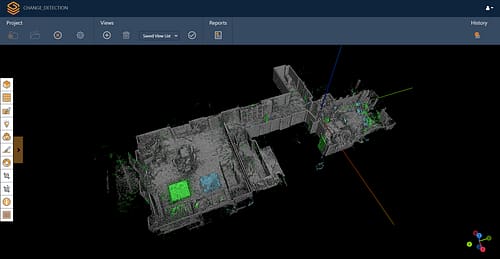
Mostly used in the construction industry, multiple point clouds can be compared and any areas that have changed are automatically highlighted. Point clouds can also be compared with CAD models – for instance to track progress on a construction site – and PDF reports can be generated to present this information.


Some SLAM software algorithms have been made available as open-source on the internet, but they are purely algorithms and not a product that you can take and use off-the-shelf. SLAM is most successful when it is tightly coupled and designed with specific hardware in mind. A generic SLAM cannot perform as well as one that has been specifically designed for a purpose.

Visual SLAM is closer to the way humans navigate the world, which is why it’s popular with robotic navigation. But in the same vein, vSLAM will have the same image-capture challenges as humans do, for example not being able to look into direct sunlight, or not having enough contrast between the objects picked up in the image. These can be overcome indoors, however, you may need to map a forest, tunnel or urban canyon. While SLAM technologies don’t rely on remote data (meaning you can scan areas where there is no GPS), you do need to ensure the SLAM technology you chose operate well inside, outside, in daylight and darkness.

Mapping a property is time-critical. Ideally, you want to make a single visit and gather sufficient data to create a highly accurate 3D model. Ensure the software you choose transforms 3D point cloud data into actionable information in real-time. This allows you to view and interrogate your data whilst still in the field, and make any adjustments, or collect missed data, then and there.

If you’re trying to map an enclosed environment (e.g. tunnel, mine) or a complex, difficult-to-access space such as a heritage building with tight stairwells and uneven floors, you need to use fully-mobile, adaptable technology. Wheel-based systems, often used with the vSLAM camera, will struggle with access. Handheld devices or LiDAR scanners that can be attached to a drone or pole and still deliver accurate results in a rugged environment are best for navigating hazardous spaces.

While vSLAM is able to provide a qualitative high-level map and sense of the surrounding features, if you’re needing survey-quality accuracy and rich-feature tracking at a local level, you’ll need to consider LiDAR. Cameras require a high-frame-rate and high processing to reconcile data sources and a potential error in visual SLAM is reprojection error, which is the difference between the perceived location of each setpoint
and the actual setpoint.

In order to deliver the depth required for high-quality data, a number of depth-sensing cameras are needed with a strong field of view. In most cases, this isn’t possible, especially as cameras with high processing capabilities typically require larger batteries which weigh down airborne scanners, or limit the time of flight. LiDAR is both faster and more accurate than vSLAM, and can deliver detailed point clouds without expensive (and timely) camera processing.