LiDAR surveying is a fast and effective way to capture 3D data. Using laser pulses to calculate distances, capture precise measurements and measure ranges is growing in popularity. This simple way to collect data is accurate, quick, and flexible.
Find out more about LiDAR mapping, and how using light detection and ranging has transformed surveying.
All About LiDAR
It’s ground-breaking mapping technology that takes surveying mobility, accuracy, time-saving and cost-effectiveness to greater heights. That’s how LiDAR was seen when it kick-started most of its development in the early 1960s, shortly after the invention of the laser. The good news is that it has continued to play an essential role in making life easier for engineers and surveyors – and more appealing for CEOs across a wide range of industries.
What’s all the fuss about LiDAR? Well, let’s find out. However, before going into what LiDAR does, let’s start by telling you what LiDAR actually is.
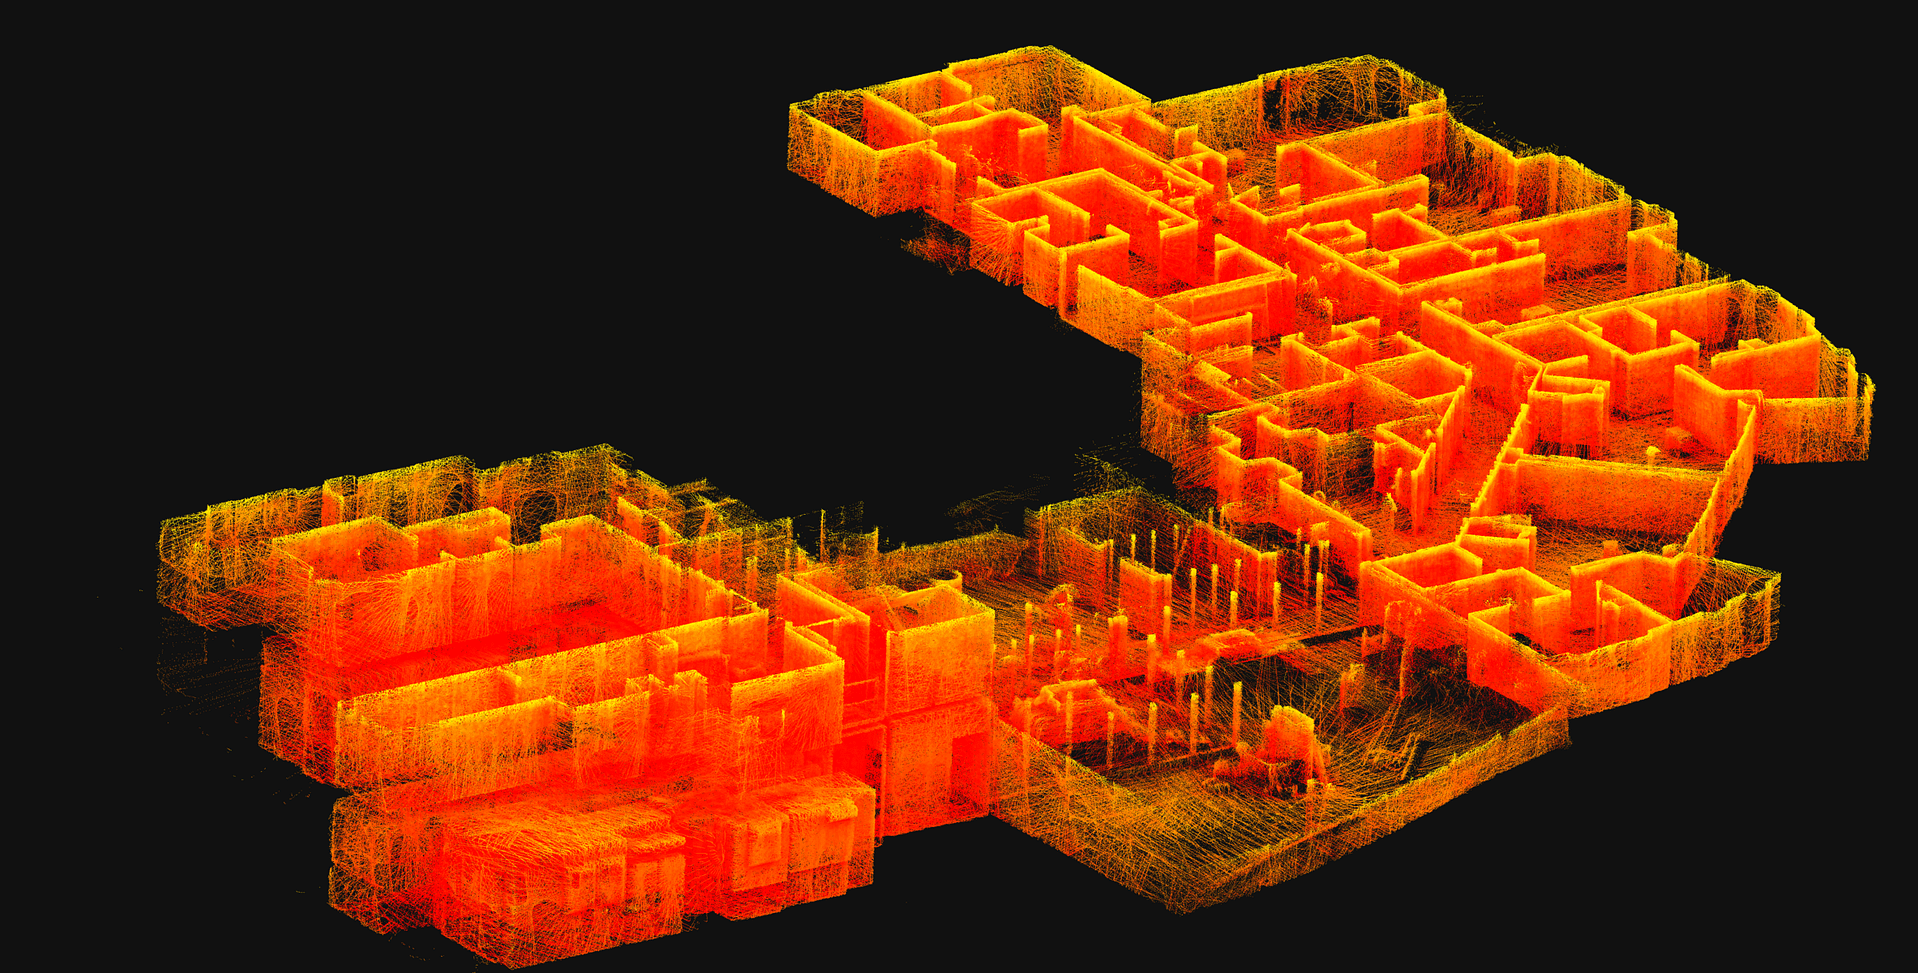
LiDAR is an acronym for Light Detection and Ranging. It’s essentially a remote sensing method that uses rapid light pulses to map out the surface of the earth. It uses the pulse from a laser to collect measurements to create 3D models and maps of objects and environments. In a nutshell, the system calculates how long it takes for beams of light to hit an object or surface and reflect back to the laser scanner. The distance is then calculated using the velocity of light. Depending on the sensor used, LiDAR scanning units can fire hundreds of thousands of pulses per second. Each of these pulsed laser measurements, or returns, can be processed into a 3D visualisation known as a ‘point cloud.’
You can find out more in our detailed article ‘what is LiDAR?’.
So, what is a point cloud?
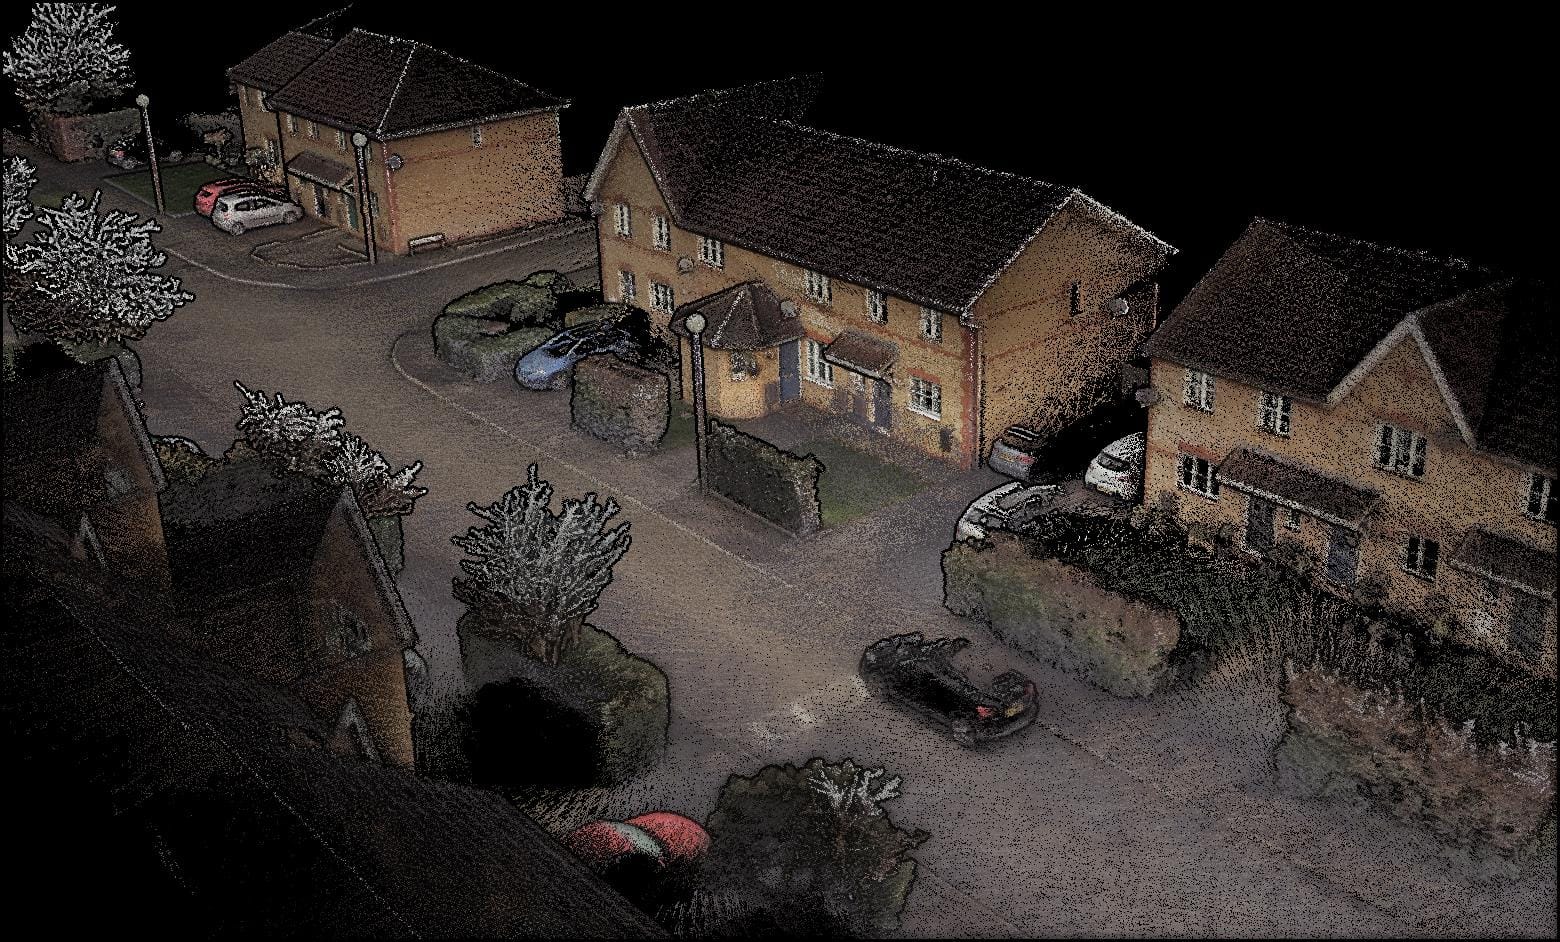
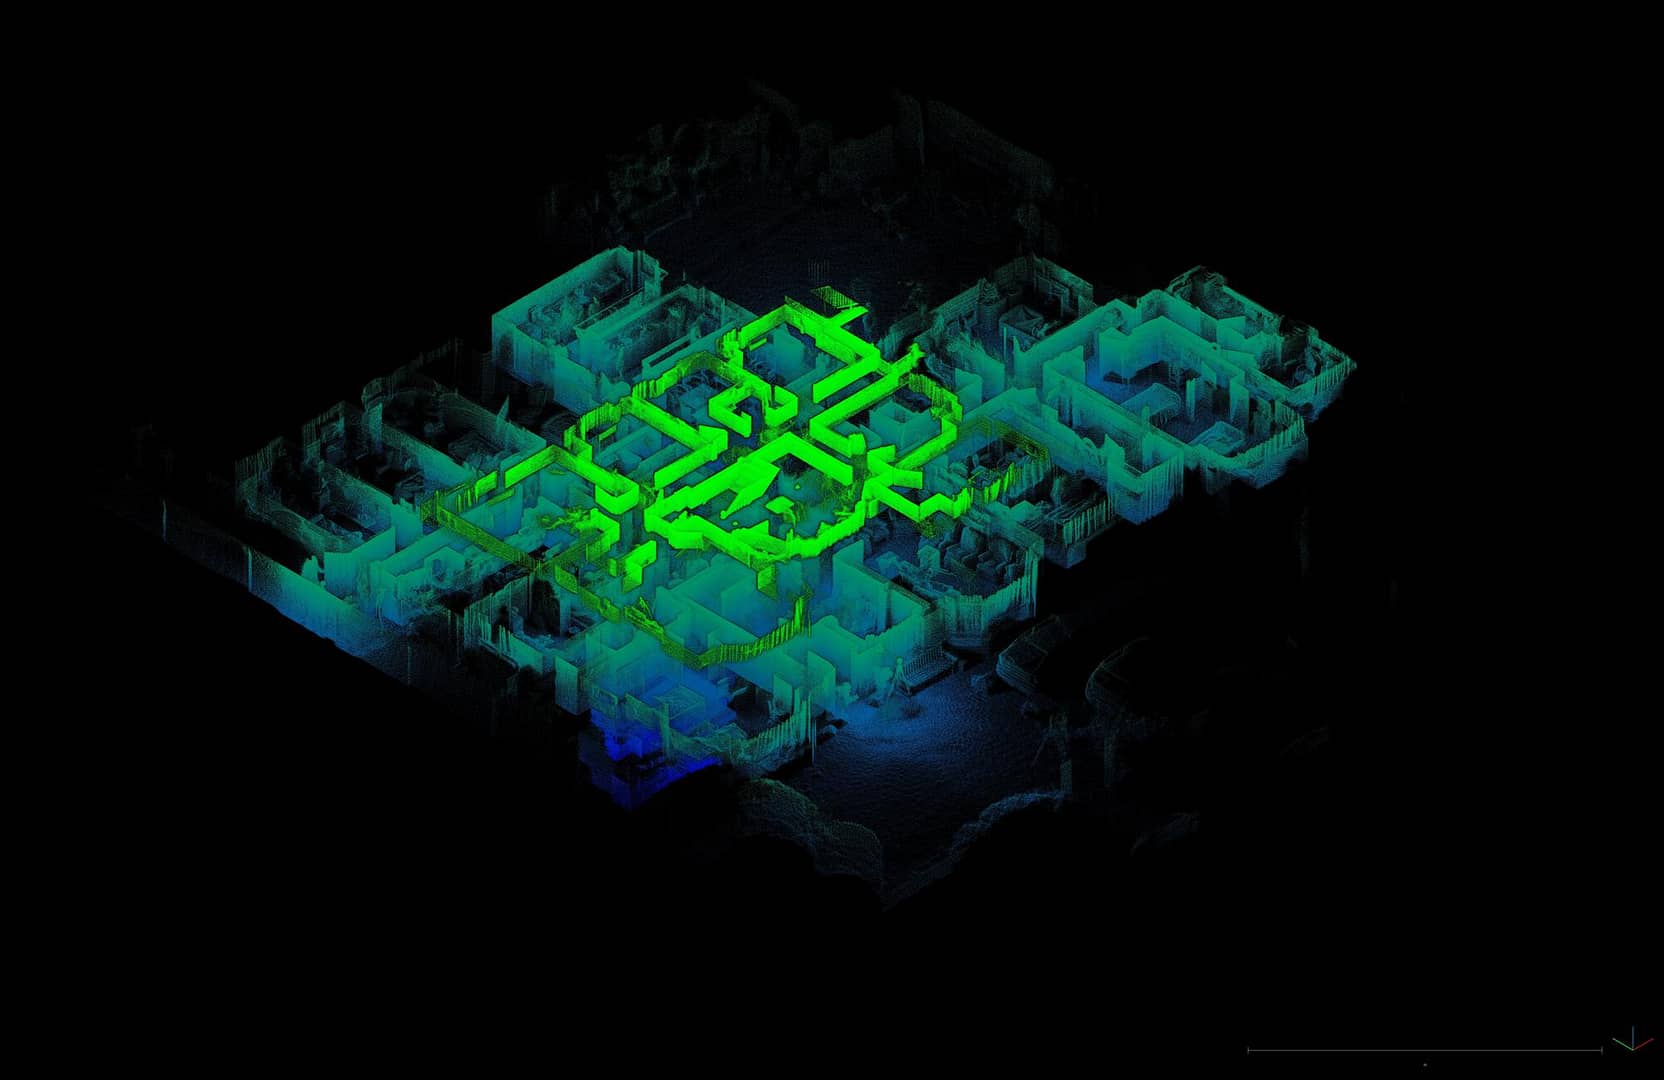
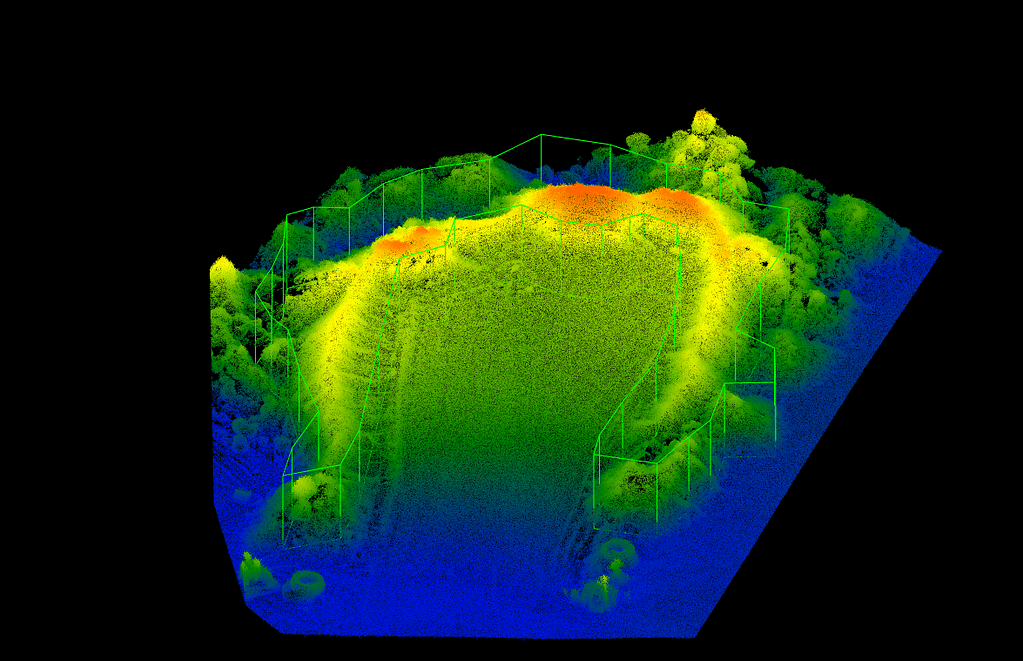
A point cloud is made up of a multitude (often millions) of points within the scans captured by a 3D laser scanner. These points represent a point on the surface of, for instance, a scanned building. The scanner automatically combines the vertical and horizontal angles created by the laser beam to calculate a 3D XYZ coordinate position for each point to produce a set of 3D coordinate measurements.
The point cloud data can then be transformed into a digital 3D model that gives you an accurate detailed picture of your building. The denser the points, the more detailed the representation, which allows smaller features and texture details to be more clearly and accurately defined.
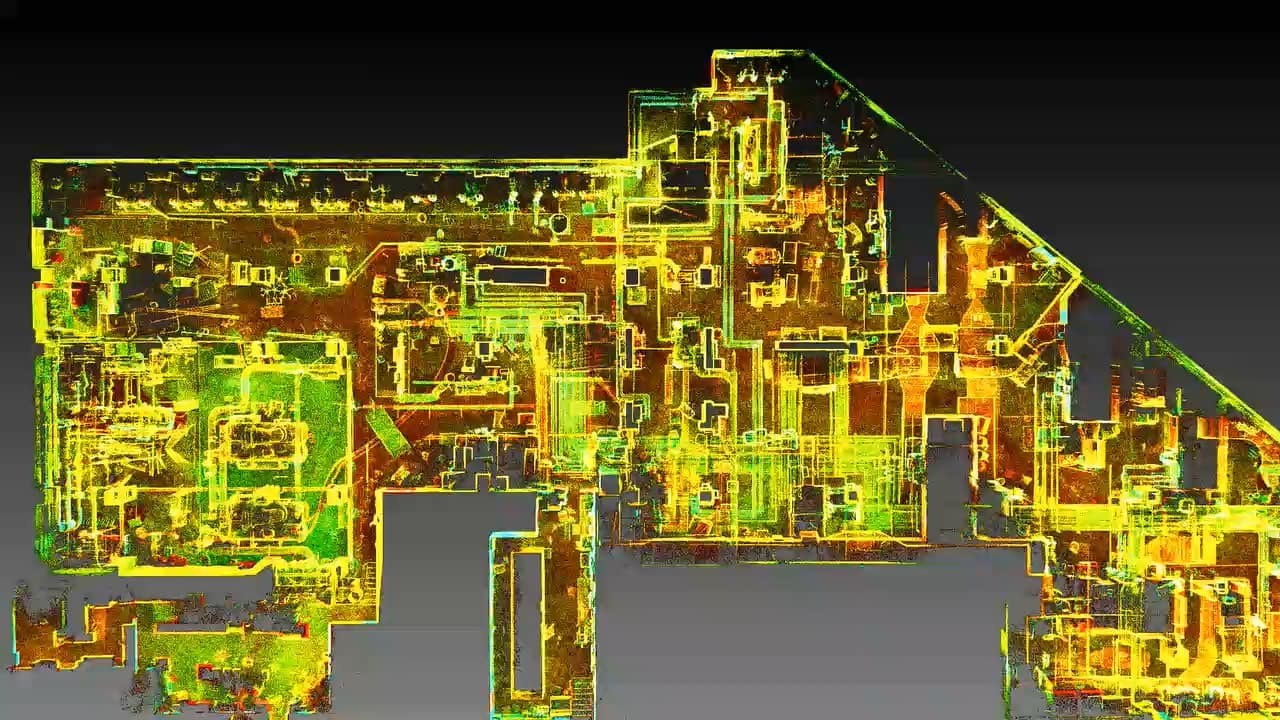
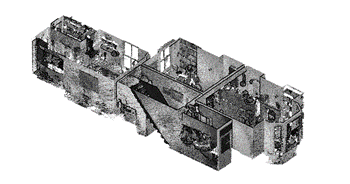
zeb revo data
What is a point cloud used for?
Point clouds are a non-intrusive way to accurately measure buildings or object properties in 3D. Sites such as hospitals, schools, and sporting venues don’t have to be shut down in order to be measured. Instead, those measurements can be taken after closing time – during downtime or out of hours. Measurements on 3D point cloud data from our SLAM based scanners can achieve survey grade accuracy.
Find out more in our detailed point clouds for beginners article. If you’d like to have a play around with a LiDAR point cloud, take a look at this sample data.
LiDAR for Surveying – how does it work?
There are two main types of LiDAR:
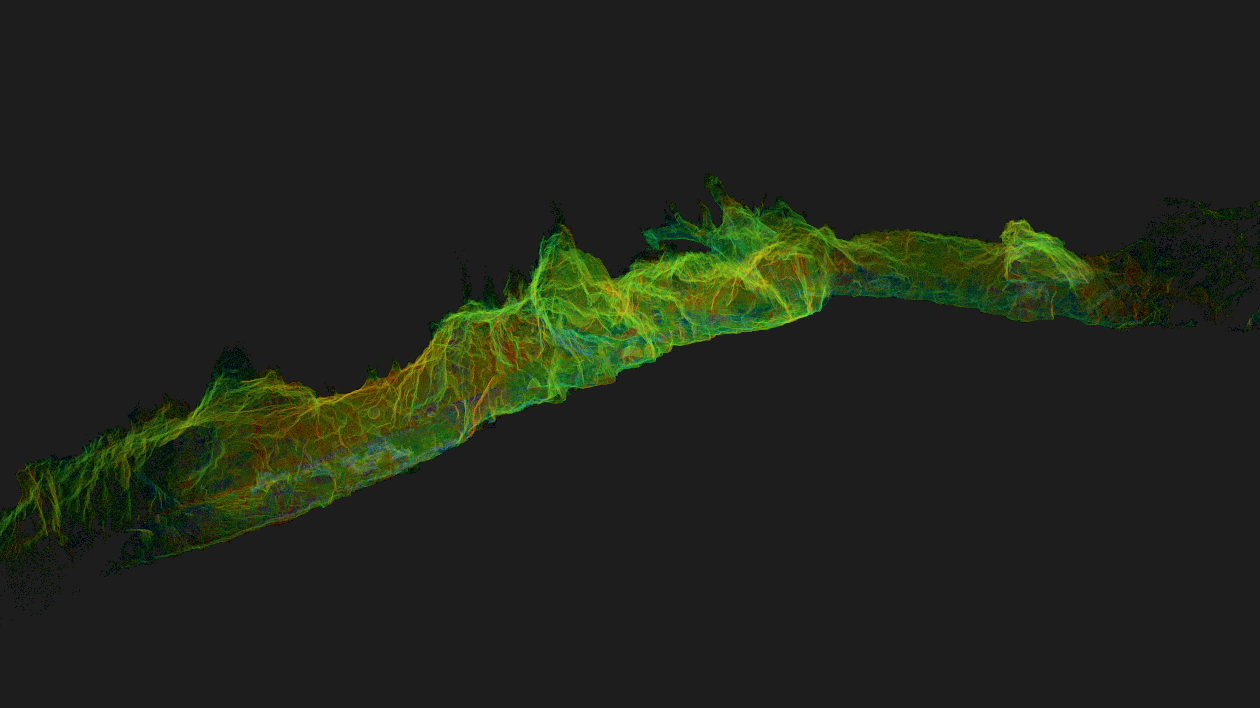
Topographic LiDAR typically uses a near-infrared laser to map the land
Bathymetric LiDAR uses water-penetrating green light to also measure seafloor and riverbed elevations.
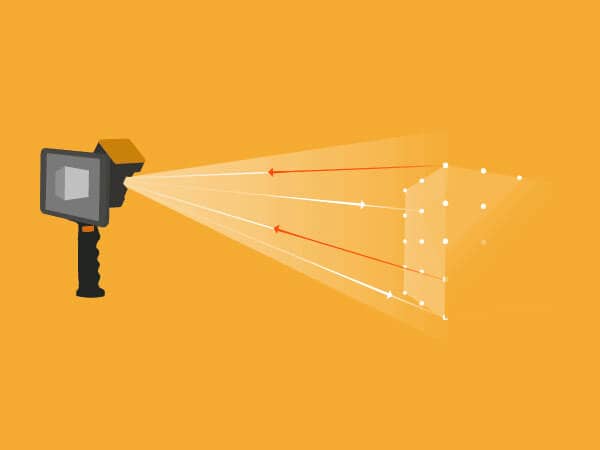
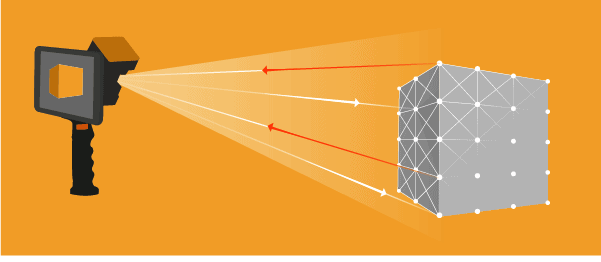
Laser-based scanners use a process called trigonometric triangulation to accurately capture a 3D shape as millions of points. A LiDAR instrument works by projecting a laser line or multiple lines onto an object. It then captures its reflection with single or multiple sensors. The sensors are located at a known distance from the laser’s source. As a result, accurate point measurements can then be made by calculating the reflection angle of the laser light.
LiDAR System for Surveying – what are the best use cases?
There are many great use cases for LiDAR. These include civil engineering and surveying, from highways and roadworks, to bridge construction and mapping large retail developments. In fact, LiDAR is extensive, allowing surveying firms to be more cost effective while maintaining the highest level of professionalism. Some great examples include:
Design
LiDAR surveying equipment and 3D scanners help civil engineers get highly accurate results in a very short space of time. Essential when working with tight timeframes.
Evaluation
LiDAR technology is perfect for creating a digital model so you can spot and correct irregularities before building work starts, as well as monitor changes between scans to show progress.
Surveying
Surveyors prefer LiDAR systems to help them create detailed 3D images, accurate digital terrain models (DTM) and digital elevation models (DEMs) of specific landscapes.
LiDAR Surveying Benefits – what sets it apart from traditional methods?
Speed:LiDAR can collect hundreds of thousands of points per second making it an exceptionally fast method of surveying. Scans of building interiors can take only minutes, and even large-scale surveys can be completed in under an hour. Without the need for GPS.
Accuracy: LiDAR systems collect extremely dense data with very little room between points. This means that the results are highly accurate. This accurate data allows professionals to plot and model natural and man-made geographies with the level of precision they need to plan detailed projects.
Flexibility: When it comes to surveying land with LiDAR, there are plenty of options to choose from. Hand-held devices are ideal for laser scanning and can be mounted on to cars, poles or drones. LiDAR data can even be collected at any time of day or night since it uses light as the measurement tool.
Safety:LiDAR systems work relatively quickly and can be operated remotely, making them a good choice for locations that may be unsafe for humans to operate or stay for extended periods.
LiDAR Drones for Surveying – how surveyors are reaching new highs
Amidst all the new consumer tech developments of the last 10 years, there’s nothing that quite excites forward-thinking surveyors as airborne laser scanning for (drone) remote surveying.
And you can see why:
Capturing topographic data with a drone can be up to five times faster than with land-based methods and requires less manpower.
The beauty of airborne lasers and drones, unlike manned aircraft, is that they can fly at a much lower altitude, and are not restricted by cloud cover in making the generation of high-resolution, high-accuracy data much faster and less expensive.
Airborne LiDAR takes the surveying out of your hands and delivers data from places that humans cannot go such as dense jungles or underground caverns.
They don’t interfere or disrupt site operations below.
There are 4 main parts of an airborne LiDAR which produce a vertical accuracy of 15 cm vertically and 40 cm horizontally. It sends over 160,000 pulsesper second. This is why LiDAR point clouds create millions of points.
1.LiDAR Sensors: As the drone travels, sensors scan the ground from side to side. The pulses are commonly in green or near-infrared bands.
2.GPS Receivers: They measure the altitude and location of the drone. These tracks are important for accurate terrain and elevation values.
3. Inertial Measurement Units (IMU): As the drone travels, IMUs track its tilt. LiDAR systems use tilt to accurately measure the incident angle of the pulse.
4.Data Recorders: As LiDAR scans the surface, a computer records all of the pulse returns. As a result, these recordings get translated into elevation.
SLAM – what exactly is it, and how is it used in surveying?
Alongside LiDAR, you’ll likely have heard the acronym ‘SLAM’ and wonder what it’s all about. SLAM stands for Simultaneous Localisation and Mapping and SLAM devices take data from sensors to build a picture of the environment around them and where they are positioned within that environment.
These sensors may use visual data (such as camera imagery), or non-visible data sources (such as Sonar, Radar, or LiDAR) and basic positional data, using an inertial measurement unit (IMU for short). The device utilizes this information to compute a ‘best estimate’ of where it is within the environment.
By moving its position within the environment, all environmental features (i.e., walls, floors, pillars) will move in relation to the device and the SLAM algorithm can improve its estimate with the new positional information. SLAM is an iterative process – the more iterations the device takes, the more accurately it can position itself within that space.
With a SLAM handheld scanner, it’s possible to simply walk through an environment and build a digital map as you go. By removing laborious set-ups from the equation, the time and cost savings are enormous. SLAM-based mobile mapping systems slash survey times and can be over 10 times faster at acquiring data. By cutting out GPS, SLAM systems let you scan by hand or by attaching a scanner to a trolley, drone, pole or cradle.
If you’d like to learn more about this ground-breaking technology, take a look here.
How to conduct a LiDAR survey
Conducting a LiDAR survey is both easy and fast:
Choose the mobile scanner you’d like to use for your project. The LiDAR works by pointing a laser at a target surface.
The surface reflects the light back to the LiDAR equipment, and the sensor records the reflected light to measure the distance travelled.
This data is then combined with the position and orientation of the LiDAR equipment, which is measured using the GPS receiver and internal measurement systems.
This creates a set of three-dimensional spatial coordinates that include latitude, longitude and height, creating a combination of data that is called a point.
When land surveying, the LiDAR equipment collectsinnumerable points using the measurement methods described above.
You now have your point cloud.
LiDAR Data
LiDAR data attributes can vary, depending upon how the data was collected and processed. You can determine what attributes are available for each LiDAR point by looking at the metadata. All LiDAR data points will have an associated X,Y location and Z (elevation) values.
Most LiDAR data points will have an intensity value, representing the amount of light energy recorded by the sensor.
The real value comes from turning raw data and LiDAR survey data into actionable information. Including being able to georeference your point cloud. With modern software, data that’s been collected can be extracted from most scanner units by either connecting the device to a PC or downloading the data to a USB memory stick. This LiDAR scan data can then be calibrated allowing analysis and modelling. Moreover, LiDAR data processing is very fast. Raw data requires just a few minutes of calibration (5-30min) to generate the final product.
LiDAR Accuracy
Depending on the environment in which the scan is conducted and the specifics of the 3D laser scanner, an accuracy of 0.002-0.197” may be achieved. This high level of accuracy helps ensure that measurements are correct the first time so that less work is needed to complete subsequent steps in design and production. Additionally, LiDAR takes the human element out of the process making the data even more accurate.
Learn about the accuracy of GeoSLAM’s handheld laser scanners here.
LiDAR Cost
When we look at the overall cost of LiDAR surveys, there are multiple cost items to be considered. First of all, the hardware: UAV LiDAR sensor sets (scanner, IMU, and GNSS) cost anywhere between tens to hundreds of thousands. How much does a drone LiDAR survey cost? It generally turns out to be about £3,000 per km2 for each of the survey grids. On the other hand, for example, GeoSLAM’s ZEB Go mobile laser scanner costs around £22,000. Furthermore, GeoSLAM ZEB products come with a software package and local storage, with no hefty storage or subscriptions costs, making it the most cost effective SLAM system available today.
LiDAR vs Traditional Surveying
We know how time-consuming it can be to set up traditional survey equipment, especially in very inaccessible environments. Fortunately, mobile laser scanners take away all this headache. You can literally create a point cloud as you ‘walk and scan’, or use remote scanning while simultaneously transmitting high-level fidelity images.
Airborne LiDAR helps to create highly accurate digital elevation and terrain models. This makes LiDAR particularly useful for example, in measuring surveying land, tree size, flood elevations, and site distances. Also, for modelling narrow objects such as power lines or road networks and poorly visible objects. All this information is captured in mere minutes – versus weeks when compared to a traditional survey crew using GPS. That means there’s no need to visit the site more than once. In short, with LiDAR you can expect three improvements over a typical survey – faster delivery, value-added service, and a better return on investment.
LiDAR laser technology in surveying has been a game-changer for many companies around the world wanting to take advantage of its many benefits, as you can see from these success stories. And it will continue to do so as the rapid development in LiDAR hardware coupled with advanced, user-friendly software offer professionals greater opportunity to conduct highly accurate surveys faster, safer and more cost-effective.
If you’d like to experience the time-saving power of GeoSLAM in the comfort of your own home or office, why not request a demo-in-a-box.
Want to see how GeoSLAM could transform your business?
Get in touch below and we’ll connect you with a local dealer.
Referencing using control points
What are control points?
Control points are points within a given area that have known coordinates. They are a key tool in the geospatial industry and can be utilised in a variety of ways, including georeferencing point clouds and aligning aerial images to terrestrial data. By using control points, surveyors are able to accurately map larger areas and position overlapping surveys of an area together. They can also be used in non-geospatial industries, such as construction and mining, to show clear temporal comparisons between multiple surveys of the same area. This method of georeferencing is also referred to as adjust to control.
Previously, checkerboards and spherical targets have been used as control markers – these items are captured in surveys and can be identified for georeferencing or aligning. The main drawback with these methods is that they rely heavily on human interpretation when processing, meaning that the processed datasets may be susceptible to an increased amount of error.
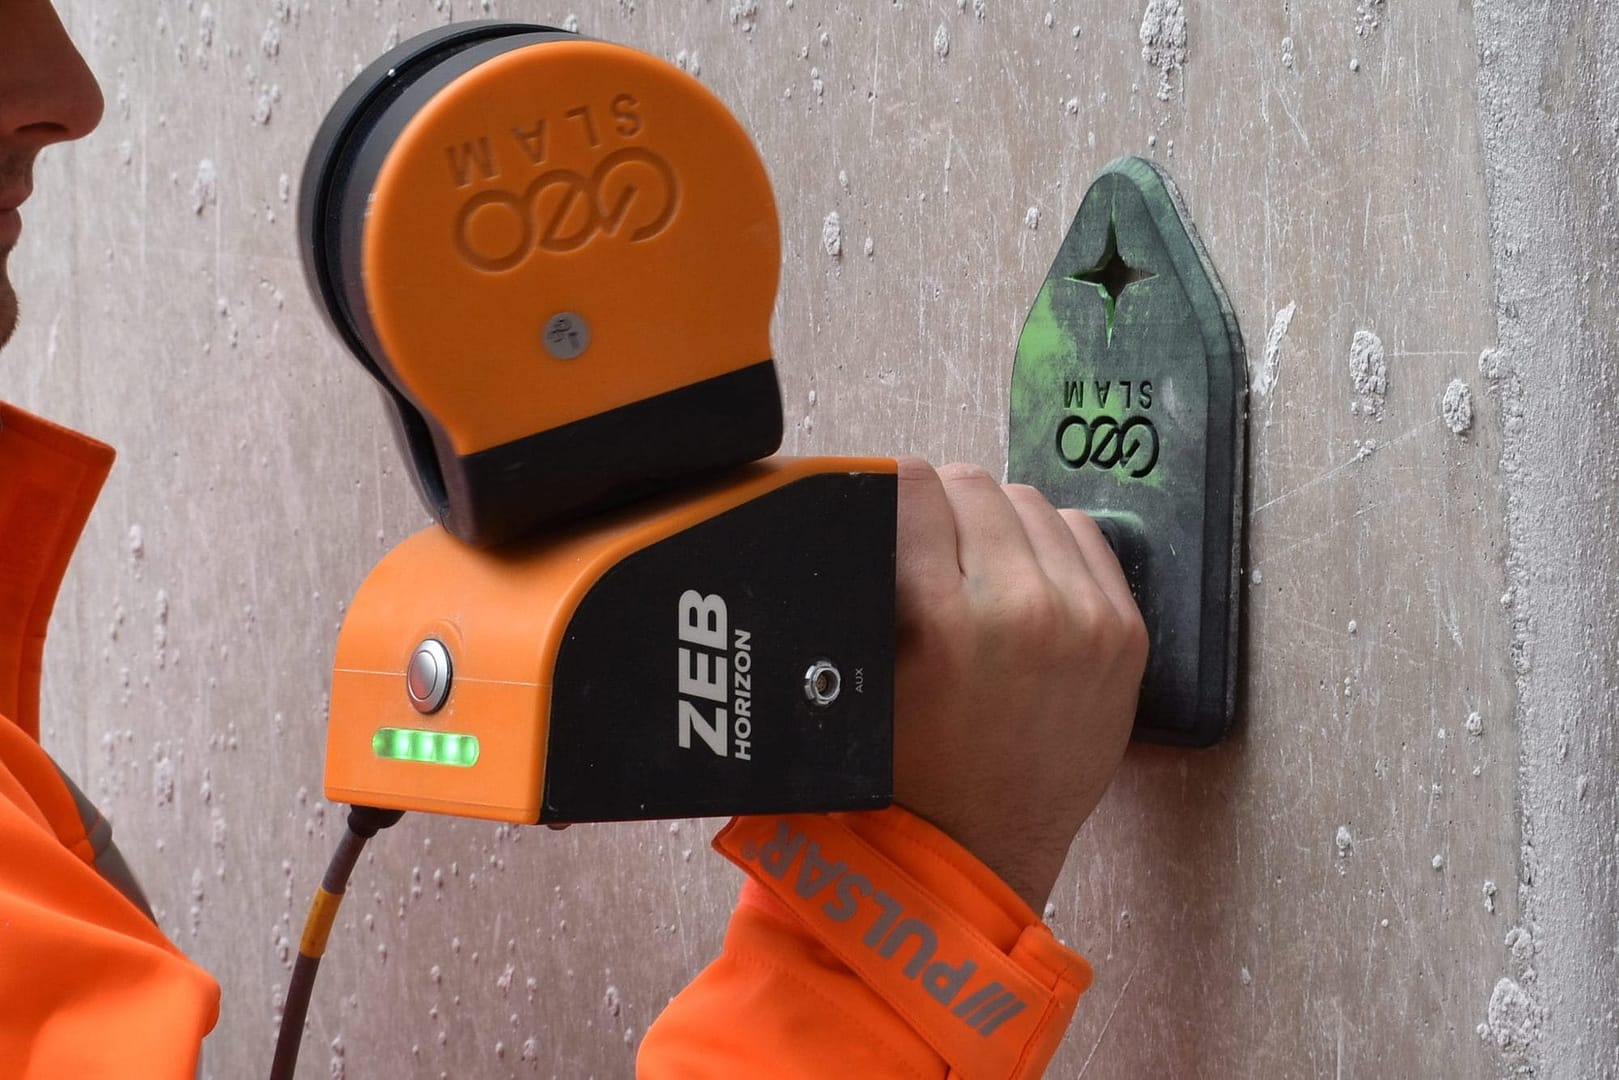
When capturing handheld surveys, GeoSLAM systems are able to collect reference points. These can then be matched with known control points to reference scans and increase the level of accuracy.
What makes GeoSLAM referencing different?
More accurate: GeoSLAM scanners are used with known control points and survey grade pins, rather than more traditional moveable targets. This reduces the margin of error within point clouds.
Save time: using known survey control points means there is no need to manually position individual targets before every scan. Data capture can then be repeated regularly, faster, easier and with no concerns that reference points are captured in different places each time.
Safer: in dangerous or inaccessible areas, targets are not required to be physically positioned on pre-defined control points prior to each scan. This reduces the time exposed to hazards and unsafe areas.
Industries using control points
Geospatial
Easily reference point clouds and produce reports highlighting accuracy values.
Mining
Regularly monitor site operations (e.g. stockpiles) and hazards.
Construction
Compare changes over time and map progress onto predetermined CAD/BIM models.
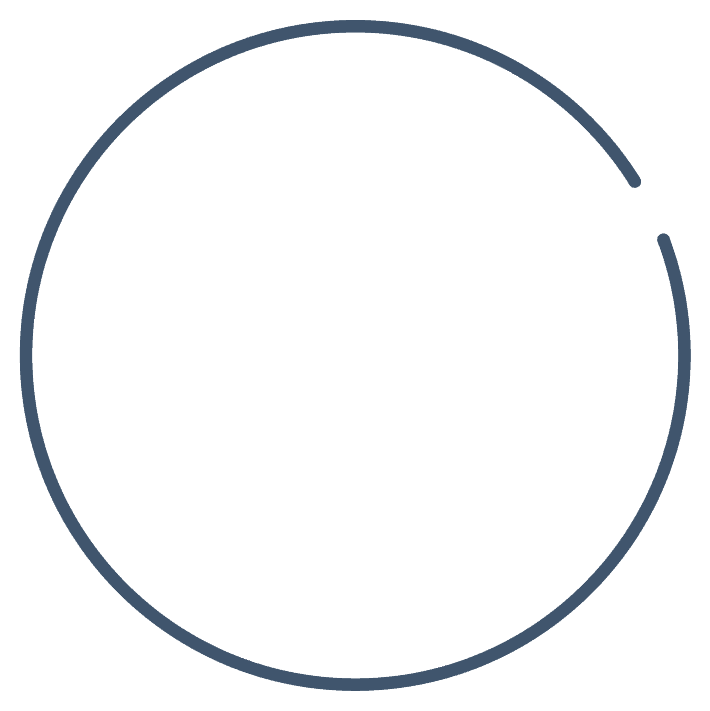
Using control points with GeoSLAM
Capture
All GeoSLAM ZEB systems are able to capture reference points using the reference plate accessory. These reference points can simply be measured by remaining stationary for periods during a scan and will be recognised during the processing stage. Points can be captured from a horizontal or vertical position, depending on which ZEB system is used, making it easier than ever to georeference datasets.
Process
Using the Stop & Go Georeferencing workflow in GeoSLAM Connect, datasets can be automatically referenced through a rigid or non-rigid transformation.
Rigid Transformation
Scans are rotated and adjusted and reference points are matched to the known control points without changing the scale factor. A single transform is applied to every data point in the point cloud.
Non-Rigid Transformation
The scale factor of datasets is altered to suit the control points – every data point is moved to a new position; this means the relative positions of these points also changes. This method is better suited for poor SLAMenvironments.
A clean georeferenced point cloud is produced using both methods. An accuracy report of the transformation is also generated and includes an RMS error value.
Point clouds with endless possibilities
Once georeferenced using control points, point clouds can be optimised further using leading third party software:
Comparisons with existing CAD/BIM models
Point cloud to point cloud registration showing changes over time within a given area
CAD/BIM model creation
For more information about our third party partnerships, head to our integrations page.
Case Study
Mapping hazardous mines under intense time constraints
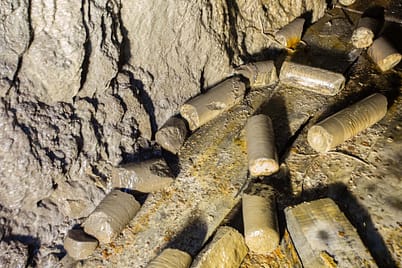
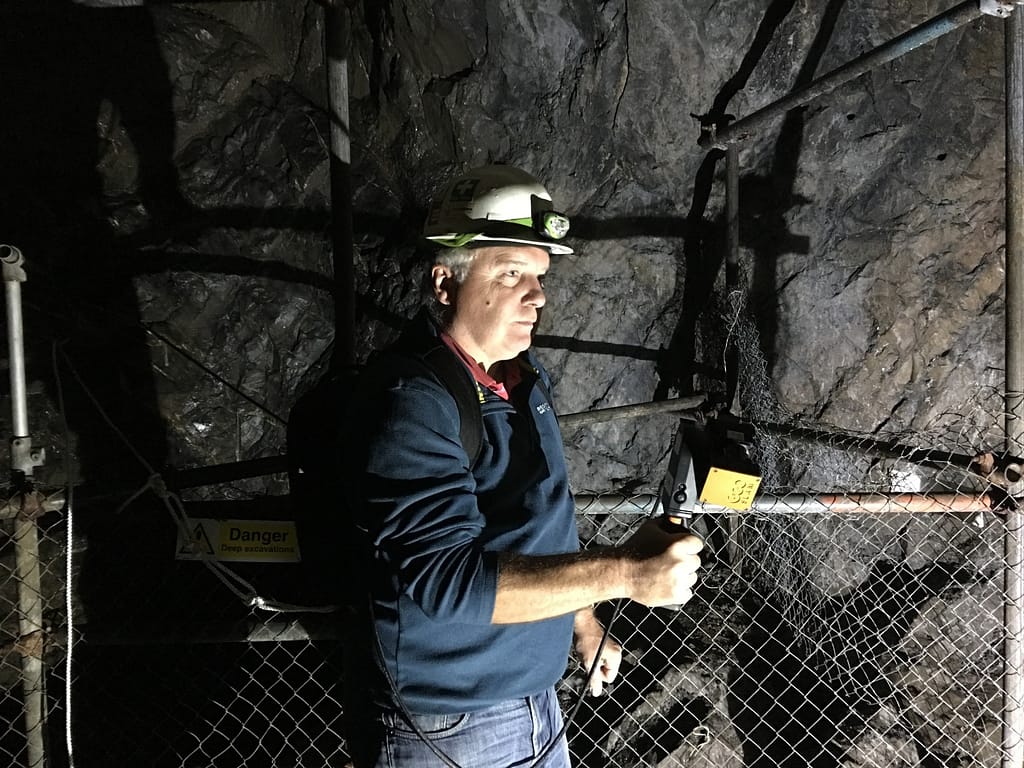
Beck Engineering, an Australian mining engineering consultancy specialising in mining and rock mechanics analysis, needs to rapidly map mines under intense time constraints using versatile technology which is adaptable to any environment. GeoSLAM’s handheld mobile mapping solution was chosen as it is compact, portable and delivers a high level of accuracy. With GeoSLAM’s “go-anywhere” 3D technology in hand, Beck Engineering has been able to supply invaluable data regarding the direct effects of mining to better understand the implications of a deforming rock mass. Beck Engineering is now able to accurately measure the shape of an excavation or tunnel over time. As a result, tunnels are safer, better designed and more cost efficient.
We have continued to use GeoSLAM products as they have proven to be affordable, lightweight and sufficiently robust devices for their application underground. GeoSLAM continues to produce a high-quality device that is at the forefront of practical mobile laser scanning devices. – Evan Jones, Senior Rock Mechanics Engineer at Beck
A collective term for modern tools that map and analyse the earth and most things on it, geospatial technology is making huge advances. These technologies help us to understand spaces, monitor changes and patterns in landscapes, cities and even societies. So, what is geospatial technology?
What Does Geospatial Mean?
To understand what geospatial technologies are, we must start with an understanding of the word ‘geospatial’. In simple terms, geospatial refers to location-specific data. Geospatial information relates to features on the surface of the earth and their geographic locations.
So when it comes to what geospatial means, it’s really anything relating to a location.
What is Geospatial Data?
Geospatial data is any data that has a geographic component to it. It can describe features, objects, or even events that have a specific location. Geospatial data will combine information about the location and attributes of an object. Location information can be either dynamic or static.
Such data can be collected in a variety of ways. Using remote sensing, geospatial data can be collected without close proximity to the area. For example, vast amounts of information can be gathered using unmanned aerial vehicles which makes gathering this information fast and effective.
Examples of Geospatial Data
Geospatial technologies can be used to collect data, but this information is represented in different ways depending on the technology chosen. Here are some examples of different types of geospatial data:
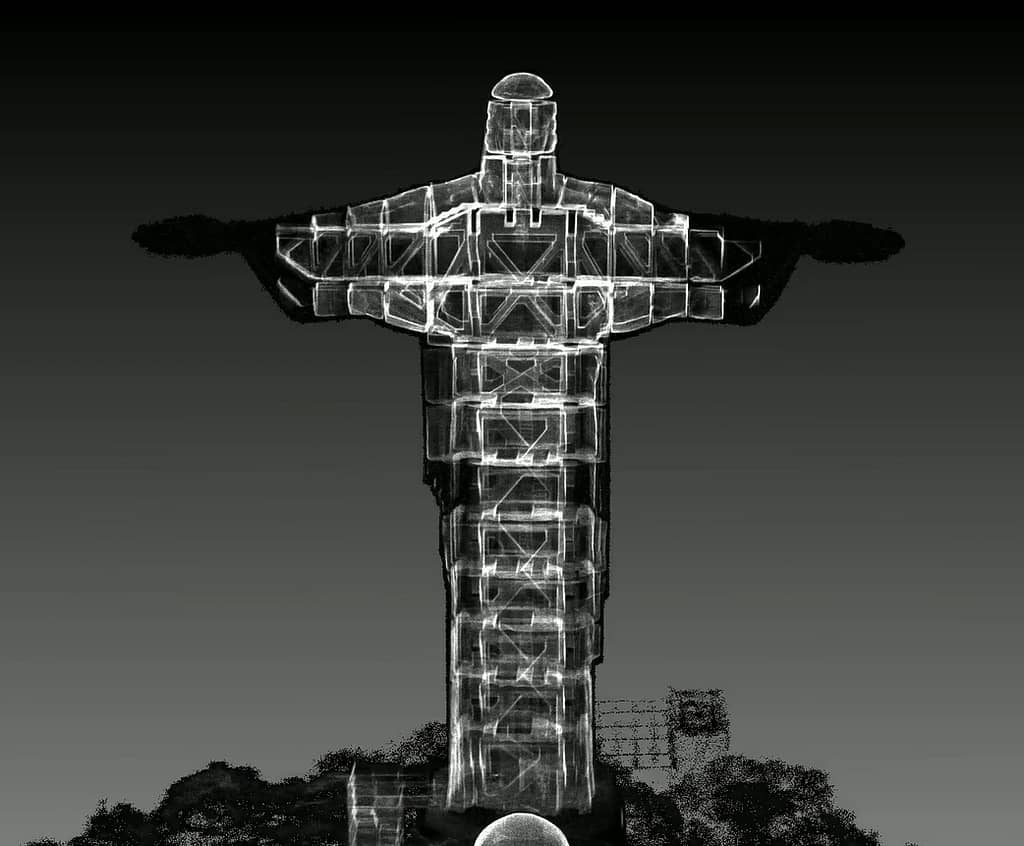
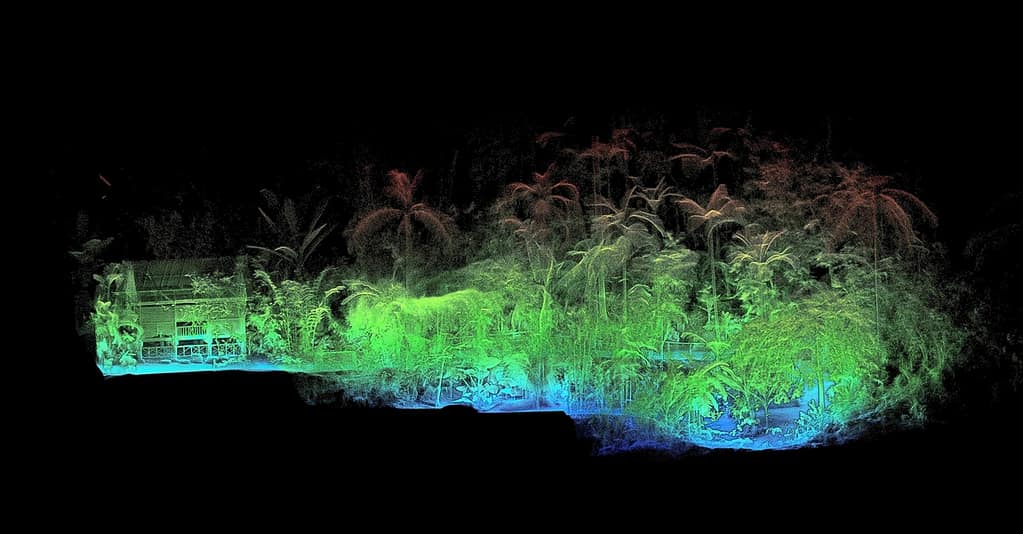
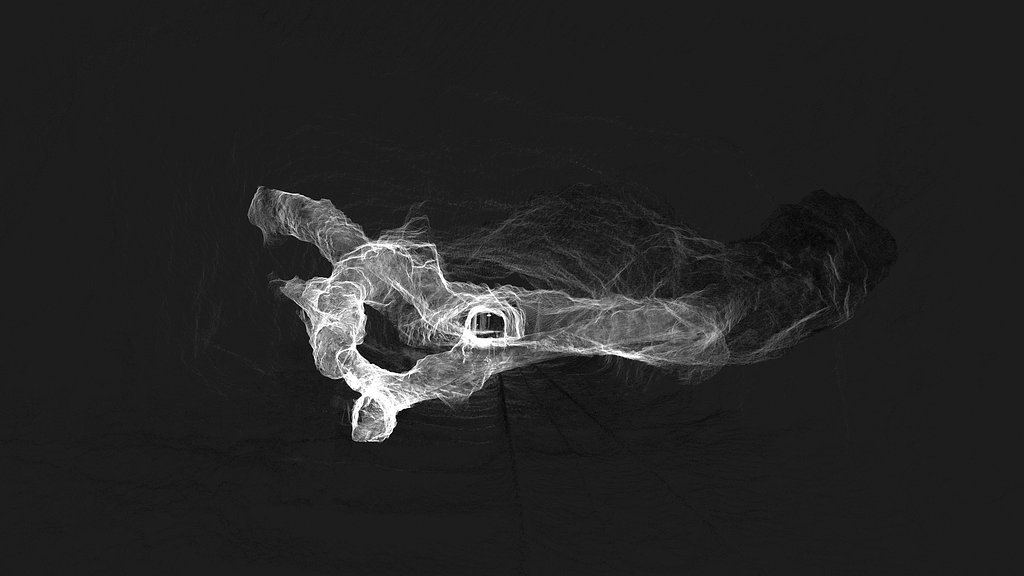
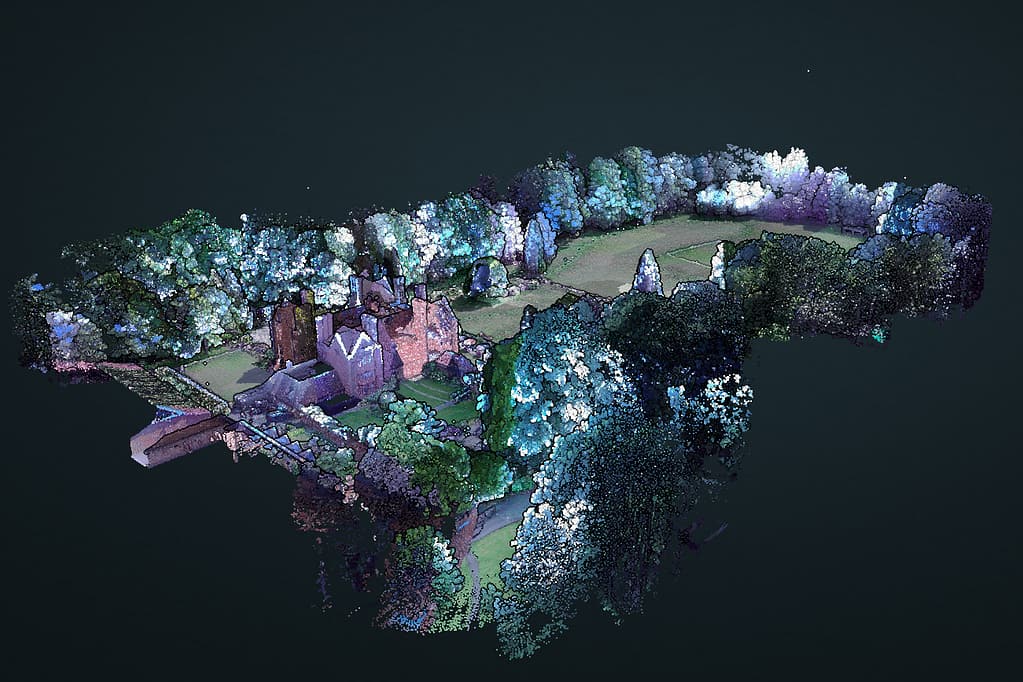
Point Cloud Data
Using remote sensing, laser scanners like our ZEB family collect a huge amount of tiny points within an environment. All these points together are called a point cloud. Each point has a location coordinate, and the set of points can be interpreted to create a 3D model of an area or object. Find out more in our article on point clouds.
Christ the Redeemer Point CloudForestry Point CloudCave Tunnel Structure Point CloudHotel Colourised Point Cloud
Vectors
Vectors consist of points, lines and polygons. Each point has a coordinate, and lines and polygons are formed by connecting these. These elements represent real-world features in any given environment. Each feature will have text or numerical attributes to describe them.
Satellite imagery
High-resolution satellite imagery is a type of geospatial data too. Satellites can help to view our world from a distance, showing us a much bigger picture.
Census data
When census data is linked to a geographic area, it becomes a type of geospatial data too. For example, city planners will use population data from a Census to plan where they might build new roads, schools or hospitals.
Who uses Geospatial Data?
There are a whole host of uses for geospatial data, which means a wide range of groups, companies, and people use it. Some examples of these are:
Military
Intelligence agencies
Retail
Maritime
Healthcare
Finance
Aeronautical
Logistics and transportation
This data can be used for analysis, modelling, simulation and more. Geographic information is vast and rich. It can be really powerful when used effectively.
So, What is Geospatial Technology?
Now that we’ve explained what geospatial means and geospatial data is, it’s time to consider how this translates into technology. Geospatial technology is used to collect and analyse geospatial data. It’s a collective term for the various modern tools and systems that help us to map the earth’s surface, understand societies and interpret spatial patterns.
Examples of Geospatial Technologies
The term ‘geospatial technology’ is broad and covers a whole host of different things. Here are some examples of commonly used geospatial technologies:
Remote Sensing
LiDAR (light detection and ranging) is a popular method of collecting spatial data using remote sensing. You can find out more about this type of laser scanning and how it works in our dedicated article: What is lidar?
GPS
A global positioning system (GPS) is a type of geospatial technology that most people have heard of and used. GPS data is collected by satellites and is used globally for navigation and geolocation. Global positioning systems have been fully operational since 1993. All modern smartphones contain GPS so you can see where you, or somebody else is on a map in near real time.
GIS
Geographic information systems (GIS) combine maps with a database of other descriptive information. Geographical information systems allow the management and analysis of location information. This type of spatial analysis has provided so much insight, it really has changed the way the world works.
A base map can be layered with other data sources to create a powerful visualization. GIS information might include things like satellite imagery, aerial photography, point cloud or vector data. Digital software brings all this information together.
As internet mapping technologies like Google Earth and Microsoft Virtual Earth become more accessible, it’s much easier for the average person to visualize data from a geographic information system.
Why is Geospatial Technology Important?
Geospatial technology enables the collection of geospatial information, and this data collection is extremely valuable. It’s so important because it can inform us about so many different things. From improving national security to urban planning, biodiversity conservation, providing humanitarian relief and even forest fire suppression, geospatial data science has so many applications. Take a look at our detailed blog covering why geospatial information is so important for more information.
Where is Geospatial Analysis Used?
In short, geospatial analysis touches every aspect of our lives. It’s used by scientists, decision-makers, conservationists, governments, urban planners, businesses and healthcare professionals amongst many more.
Geospatial information is often used for research and development. It can be used in modelling and simulations, which can inform future decisions. It gives people the ability to create a virtual world that can be tested and simulated to measure effects, so decisions can be made more safely. Geospatial analysis enriches our understanding of the world around us and has opened up so many possibilities.
Want to see how GeoSLAM could transform your business?
Get in touch below and we’ll connect you with a local dealer.
Point Clouds for Beginners
Your questions answered
With mobile mapping technology readily available, anyone can effortlessly map the environment around them, whether it’s a cave, 10 storey building or a construction site. For newcomers to surveying, this tech breakthrough removes the dependency on trained experts – but it does require the mapper to have a basic understanding of a point cloud. What is it, how is it created and how is it used? In our latest education article, we look at the top point cloud questions and provide all the information you need to get started.
Point clouds are now faster, easier and more accessible than ever before. If you’re interested in mapping but aren’t trained in point cloud software – this guide is for you.
1. What is a point cloud? What measurements are included in a point cloud?
A point cloud is essentially a huge collection of tiny individual points plotted in 3D space. It’s made up of a multitude of points captured using a 3D laser scanner. If you’re scanning a building, for example, each virtual point would represent a real point on the wall, window, stairway, metalwork or any surface the laser beam comes into contact with.
The scanner automatically combines the vertical and horizontal angles created by the laser beam to calculate a 3D X, Y, Z coordinate position for each point to produce a set of 3D coordinate measurements which often includes its colour value stored in RGB (more on that in question 6) and intensity. These details can then be transformed into a digital 3D model that gives you an accurate detailed picture of your object.
The denser the points, the more detailed the representation, which allows smaller features and texture details to be more clearly and precisely defined. So, if you were to zoom in on a point cloud of The Tower Bridge in London, you’d see tiny points creating the whole point cloud.
Point cloud scanning is the process of using a 3D laser scanner to capture different points, measuring an area. You can quickly generate a point cloud with mobile mapping devices to capture dimensions, size and layout data.
What is Point Cloud Data?
Point cloud data is the term used to refer to the data points collected for a given geographical area, terrain, building or space. A LiDAR point cloud dataset is created when an area is scanned using light detection and ranging.
What is Point Cloud Processing?
Point cloud processing is a means of turning point cloud data into 3D models of the space in question. This data processing is made possible with processing software such as GeoSLAM Connect.
2. How do you create a point cloud?
Firstly, scan your object with an easy-to-use 3D laser scanner such as a ZEB Revo RT. When creating 3D point clouds, you might find that some objects need multiple scans from different viewpoints which are then merged in the software later. This is because a three-dimensional scanner can only record data points for the surface within the scanner’s line of sight and the object may need to be passed twice to capture the entirety of its geometry and reduce occlusions (gaps in data).
Next, remove the USB memory stick and plug it into your computer. A 3D scanning software, such as GeoSLAM Connect, will render the points from the raw data in real-time to give you a complete point cloud to represent your object in 3D space.
LiDAR vs Photogrammetry
There are two different methods of creating a point cloud, LiDAR and photogrammetry. Whilst either of these systems do the job, LiDAR laser scanning has an increased accuracy.
3. How long does it take to create a point cloud?
It all depends on how many scans are needed and what exactly needs scanning. Or whether you’re using traditional stationary scanning equipment or mobile laser scanning technology which would considerably reduce scanning time. For example, a 130-scan point cloud dataset (which is a lot of point cloud data) of an office building including all the individual rooms, corridors and service areas could take nearly 25 hours to process with a traditional, static laser scanner.
Those scans may have only taken a day to collect with a mobile scanner, but manual involvement in processing means that the registration of that point cloud dataset can take around 3 days to carry out, and potentially longer if manual correction is necessary. Smaller datasets can be processed in hours.
With a device like the ZEB Revo RT a slam point cloud is created in real-time and you can see the live visualisation progress with the attached tablet or phone. It requires no processing other than extracting data from the device, so you can have a full point cloud in a matter of minutes – depending on what’s being scanned.
4. Do you need to be trained in point cloud software to create a point cloud?
GeoSLAM’s Connect software is specifically designed for ease-of-use. With minimum training on the software, you will be able to process raw point cloud data by directly transforming it into BIM (Building Information Modelling).
Its menu is easy to understand and the tools and functions let you navigate your way through the cloud easily and efficiently. With GeoSLAM Connect you can create clean, georeferenced point clouds automatically.
GeoSLAM Connect – point cloud measurement
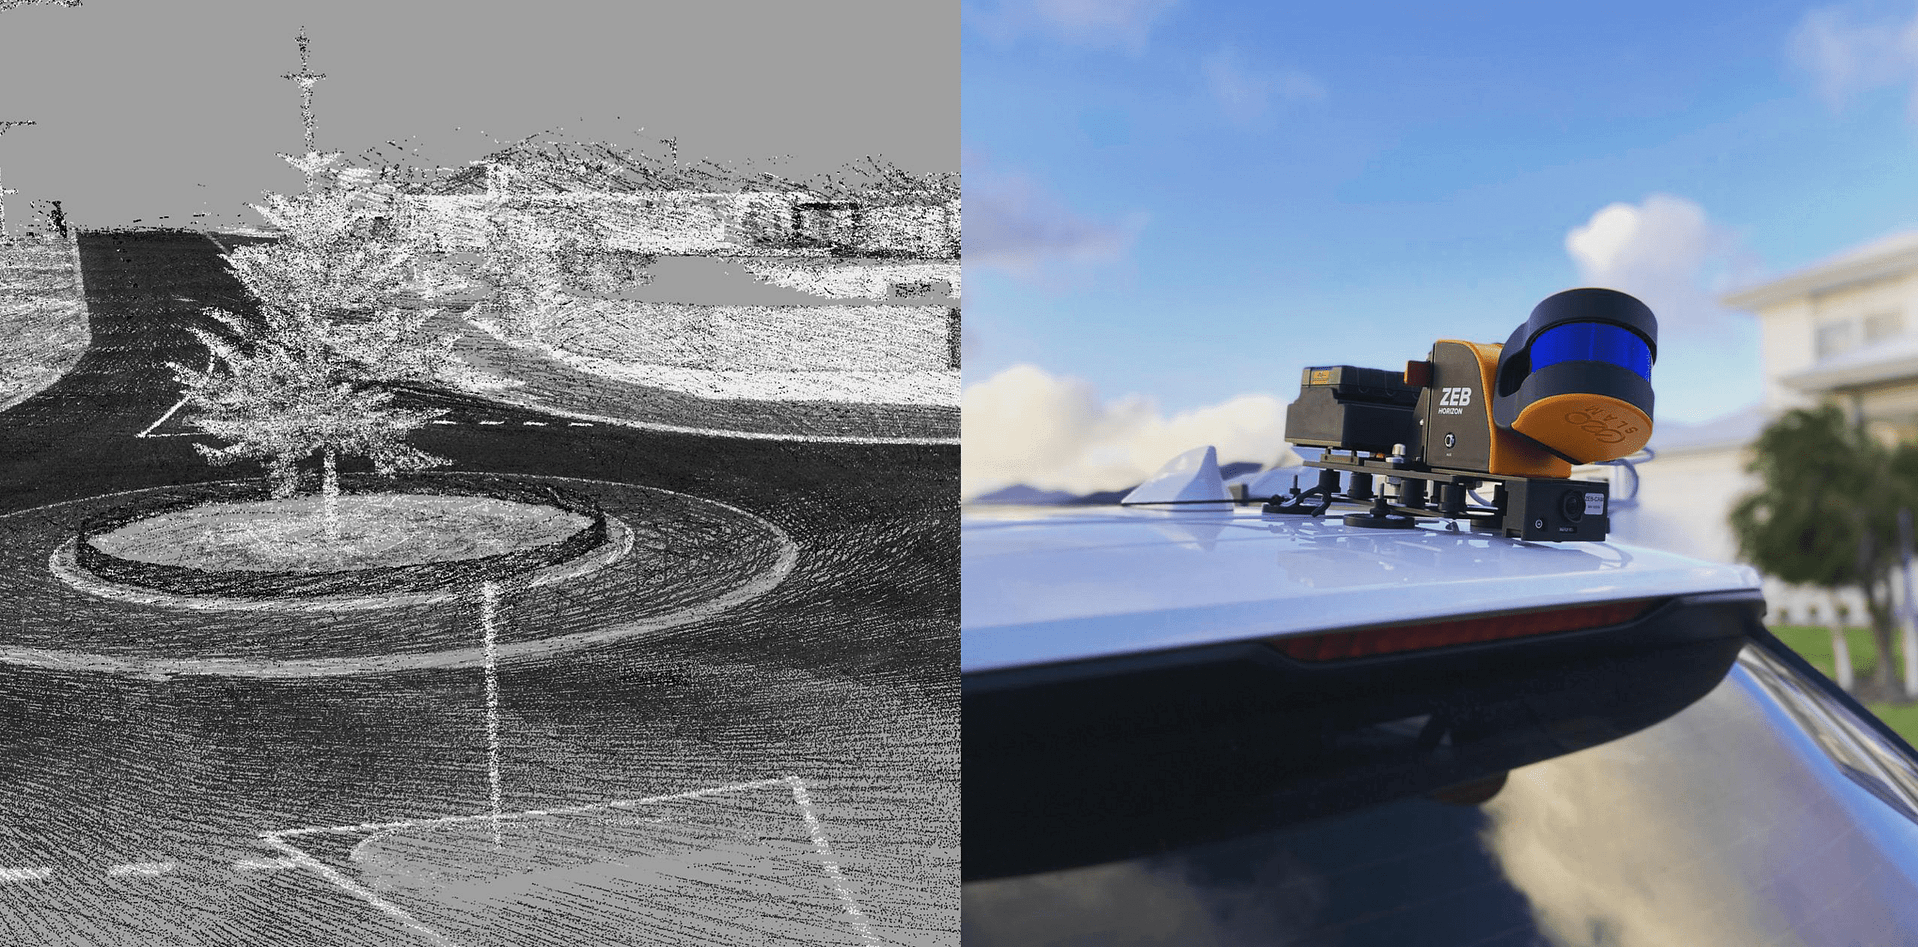
Point cloud data collected using the ZEB Horizon mounted to a UAV
5. What is the perspective on a point cloud?
Since a point cloud is a fully 3D format, you can view it from any perspective, no matter what device was used to capture it. You can capture a point cloud on foot using a handheld 3D laser scanner such as a ZEB Horizon, and then view it from the top-down as if you’re seeing the scanned environment from a drone. In fact, you can view any part of the point cloud, including objects and rooms, from any angle as required.
6. Can a point cloud be created in colour – how?
When you look at a colourised point cloud of a room, you’re seeing both the dimensional measurements and the RGB value. This data is taken at each point the scanner measured. The effect is that users (both new and experienced) can understand quickly and easily what they’re looking at because the point cloud looks more like a 3D photograph. When using a GeoSLAM ZEB Horizon, colourised point clouds can be created by using the ZEB Vision accessory and workflow within the GeoSLAM Connect software. Learn more about how to colourise a point cloud here.
GeoSLAM point cloud animation of a warehouse facility in the UK
7. How do you put multiple point clouds together?
Handheld 3D laser scanners are efficient enough that many spaces can be captured in a single scan. However, larger projects such as a large sports arena or campus may require more scans for complete coverage, which means you’ll have a number of point clouds that you’ll need to merge into one final point cloud for the whole asset. A variety of software applications enable you to do this. However, if you use a GeoSLAM laser scanner, it makes good sense to use GeoSLAM’s complimentary Connect software.
Within GeoSLAM Connect you have the stop-and-go alignment feature where common static points are captured during several scans meaning that these datasets can be automatically aligned. A single point cloud is then exported as if the data was captured in a single scan.
stop-and-go alignment feature in GeoSLAM Connect
8. What are the best point cloud formats to use?
Different scanners produce raw data in multiple formats, and each piece of software has different exporting capabilities. Output formats are also determined by what data is required and who needs it. If you wanted to store the data away for a long period, you’ll probably be best storing the point cloud as an ASCII file. Other popular formats are LAS, PTS, PTX, XYZ and Fast Binary.
GeoSLAM data is compatible with software that works for you with universal file formats (LAZ/LAS/PLY/TXT/e57) and can be imported into many different third party software’s such as Deswick, Esri, Micromine and Floorplanner.
9. What is a point cloud used for?
It’s a non-intrusive way to accurately measure object properties in 3D. For example, sites such as care homes, stadiums and museums don’t have to be shut down in order to be measured. The measurements are also far more detailed than anything traditional survey equipment can produce.
In the architecture industry, which uses As-Built models; point cloud software eliminates time-consuming and costly revisits to the site and allows an architect to visualise and convey new concepts. Point cloud has become the new standard for all design industries as it provides an instant virtual model to test ideas with. They are also used to create 3D CAD (computer-aided design) models for manufactured parts, for metrology and quality inspection, and for a multitude of visualisation, animation, rendering and mass customisation applications.
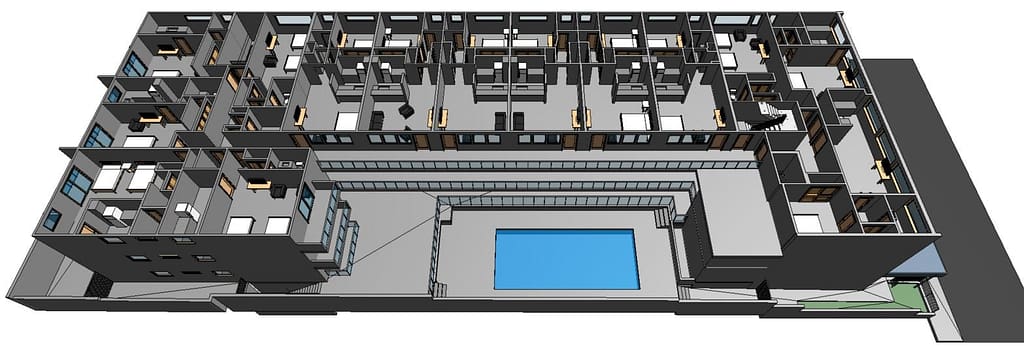
Here’s an example of the GeoSLAM ZEB Horizon data being used to create a BIM model for a large hotel using Revit.
We hope this gets you out of the blocks and you quickly become a point cloud enthusiast. Creating point clouds is both easy and simple – and anyone can do it.
Looking for some inspiration on taking your point cloud to new places, check this out. You can also visit the Point Cloud Library here.
Contact us
Blogs
Keep up to date with the latest news and thought leadership from GeoSLAM.
Improving quality assurance & quality control whilst reducing costs
The history of shotcrete
Since its conception in the early 1900s, shotcrete application has developed to become one of the most critical ground supporting techniques for underground excavations. The technology has evolved from manual nozzle handling to computer guided, hydraulically controlled boom-mounted nozzles. By controlling variables in the shotcreting application, the layer of sprayed concrete can be optimally designed to meet the in-situ geotechnical constraints. In some scenarios, shotcrete will be designed to flex with the squeezing rock, whilst in others, it may simply act as a barrier to protect from rock bursts.
Understanding how the shotcrete will react in different conditions allows operators to apply the right amount of material. Shotcrete thickness is paramount when applying shotcrete, therefore it must be monitored during application using the safest and most reliable method. The aim of this article is to demonstrate how the SR-50 system, developed by GeoSLAM, is suitable for near real-time shotcrete application quality assurance and quality control (QA/QC).
Shotcrete – The modern method with failing processes
The Sika Sprayed Concrete Handbook (1) states that the only method for accurately calculating initial strength is by measuring thickness. Current methods rely on operators endangering themselves to un-secured shotcrete in order to manually collect thickness readings. A total of 5% of all tunneling injuries can be attributed to the shotcreting process in tunneling (2). Industry professionals recognise the need to balance the provision of a safe working environment for its operators with the demand for increased production rates, accurately measured and documented shotcrete thickness.
In 2016 GeoSLAM developed the SR-50 system deployed throughout the Jetcrete Australia fleet. The technology has now been licensed to Normet Oy who have adopted the technology as SmartScan.
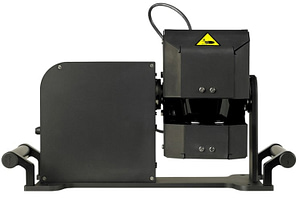
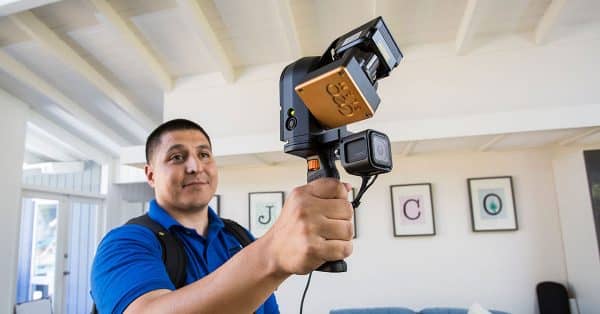
SR-50 System
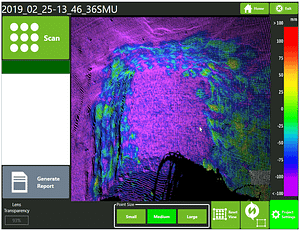
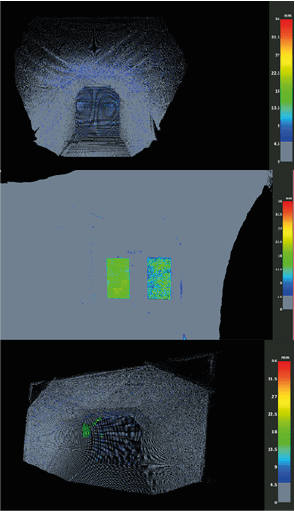
SR-50 Software Interface
The system provides the operator with near real-time results displaying shotcrete thickness after each application cycle with a single button press. A colour-coded map of the spray area allows the operator to identify regions of concern easily and accurately. Once the operator is satisfied that the sprayed thickness complies to site criteria an electronic report is automatically created. This report documents the application cycle, providing the average applied thickness, total volume of shotcrete applied to the surface and the final thickness map that can be used for quality assurance. All data is stored on the system for further analysis and archiving. Without exposing the operator to dangerous conditions, the system can act as a training tool for novice operators, as well as aiding experienced operators to spray to the desired profile thickness, thus minimising overspray.
Analysis of data collected from sites using the SR-50, showed an approximate 20% reduction in overall concrete usage. This means that an average single sprayer operation can reach a return of investment within 2-3 months, have improved safety, and expedite the shotcrete application process.
The system created by GeoSLAM now achieves an accuracy of less than 5mm. This measured accuracy and reliability of measurement now enables the large-scale use of the technology on multiple sites.
The need to modernise
Traditional methods for measuring shotcrete thickness are based on invasive in-situ sampling at discrete points. Samples are taken either, when the shotcrete is freshly applied, e.g., Fibercrete Depth Indicators (FDI’s) or once the shotcrete has fully hardened, e.g. ASTM C174 drill core test. In both cases these methods have been shown to be unreliable and disruptive to the work cycle.
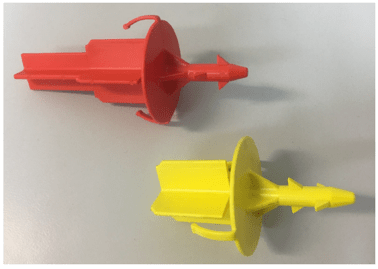
Fibrecrete Depth Indicators (FDI)
FDI’s are used by inserting “shotcrete stamps” into freshly applied shotcrete using the boom of the spraying rig. An investigation carried out at Olympic Dam in 2018 concluded that FDI’s were incredibly disruptive to the operation as well as poor measurement technique to represent the whole heading (3). For a typical profile heading with a cut length of 4.0m, the surface area sprayed was approximately 55m2. 20 probe sites were sampled, resulting in a sample area of approximately 0.05m2, or just 0.0009% of the sprayed surface.
Drill Core Tests
Where drill core tests are taken most sites typically only manage to measure samples to the nearest 10mm, and again there is an element of bias towards where these drilled samples are taken from along the profile of worksite. Aside from an unsatisfactory sample size and potential for bias, the above methods either have the potential to damage the spray rig boom or are conducted hours after spraying, so any issues are not resolved at the time of application which result in time delays and extra costs.
There is an increasing trend in tenders and contracts throughout the shotcreting industry, requiring that shotcrete thickness be accurately measured and documented across the whole sprayed surface. Therefore, new, and novel methods must be used to meet the contractual obligations whilst minimising the disruption to the work cycle. The use of Laser Scanning technologies can meet these demands by providing non-invasive measurements at the time of application; sample points that can run in to the hundreds of thousands, overcoming sample bias; all taken in a handful of minutes immediately after the application meaning that any remedial action is taken immediately.
Laser Scanning: Accuracy benchmarks
Terrestrial Laser Scanners (TLS) and Scanning Total Stations (STS) systems are based on laser technology and are commonly used across numerous surveying sectors where accurate range measurements are required. Typical systems have accuracies that range from sub-mm to several mm’s depending on the underlying technology and cost. However, in the underground environment these technologies tend to be extremely expensive, complex to use, often requiring specialist training, and can require time-consuming processing in an office environment to produce results. The SR-50, although based on laser scanning technology was specifically designed for the shotcreting industry to be simple to use, automated, cost effective and accurate.
To evaluate the accuracy of the system a rigorous approach was developed. The assessment criteria relied on the use of a TLS (Riegl VZ-400) that was deployed in a controlled environment. The TLS was chosen on the premise that to assess the accuracy of the SR-50, the reference data must of greater accuracy than the test data. The ability to control any changes in the environment was paramount to avoiding ambiguities in the results.
An artificial tunnel environment was constructed with cross-sectional dimensions similar to those in the mine tunneling environment. After an initial base scan of the environment, using the TLS and SR-50 a series of control-panels of known thickness (verified using vernier callipers) were introduced at varying positions in the tunnel. After each control-panel was introduced, changemaps were calculated from SR-50 and the TLS data. Thicknesses of 8, 13, 18 and 30mm were used.
The Results
The first assessment of the SR-50 system was to compare comparison results of the test environment with no change against the results using the TLS. Since, there was no physical change to the environment this provided an indication of the repeatability of the system. This assessment was then repeated by placing 8mm, 13, 18 and 30mm boards into the scene and measuring the average thicknesses using the SR-50 and TLS data.
The top image shows the comparison map derived from the SR-50 when no change was made to the environment. The middle shows a comparison of the computed changemap from the TLS control-panel (LHS) and the panel measured by the SR-50 (RHS), both for a 13mm control-panel. The figure clearly shows that the SR-50 gives comparable results to the TLS. The changemap for the TLS gives a more consistent result due to the much higher point density. However, the measured average change across the panels are the same. Control-panels were also attached to the sides and shoulders of the test area and an example changemap is shown in the bottom image.
Board Thickness (mm)
0
8
13
18
Smartscan Selection Mode Difference (mm)
0
0
0
0
Third Party Difference (mm)
0
1
1
1
The above table provides results for the comparison between the average thickness of the control-panels measured using the TLS and SR-50. To assess the accuracy of the automated changemaps created in the SR-50 software, the raw data was exported and thickness maps were calculated in a 3rd party software. The results show good agreement with the on-board solution available at the time of spraying.
Conclusion
By using laser technology and scanning the working area before and after shotcrete application, shotcrete thickness is automatically calculated across the complete working area in near real-time.
To provide an initial assessment of system accuracy, a series of measurements were undertaken in a man-made, controlled area. A series of control-panels of known thickness were introduced into the environment and thickness maps calculated by the SR-50 were compared to maps created using a Terrestrial Laser Scanner of much higher specification. Additionally, the results automatically created by the system were compared against results created manually in a 3rd party software package.
The results showed that thickness maps created using the SR-50 system were comparable to a TLS system. Average control-panel thickness was typically within 1-2mm between the two systems. The investigation shows that the SR-50 is accurate and reliable enough for the shotcreting industry. When comparing to the inaccurate in-situ measuring the industry has previously adopted (such as the ASTM C174 drill core test), the SR-50 can provide reliable results across the whole sprayed face in near-real time. The system is able to:
Provide an accurate thickness report every time a spray is required
Drastically reduce shotcrete wastage by helping the spray application process in achieving its desired thickness in a single attempt
Ensure geological ground control is achieved and upheld during the full shotcreting operation
Help nozzle-persons gain experience in spraying by providing near-real time thickness results.
As shotcreting becomes more common in mining and infrastructure projects around the world, the industry needs to evolve to accept the need for strong QA/QC methods and reporting in near-real time.
References
Sika Services AG. (2020). Sika Concrete Handbook. Available: https://www.sika.com/content/dam/dms/corporate/t/glo-sika-concrete-handbook.pdf. Last accessed September 2020
Kikkawa N, Itoh K, Hori T, Toyosawa Y, Orense RP. Analysis of labour accidents in tunnel construction and introduction of prevention measures. Ind Health. 2015;53(6):517-521. doi:10.2486/indhealth.2014-02
Unpublished site report: Olympic Dam, BHP, 2018.
From Analogue to Digital
How real estate companies are embracing digital technology
The Real Estate sector is on the move
With ever accelerating technological advances year on year, businesses across all sectors cannot afford to become complacent. We only have to think of companies who have failed to innovate and have been left behind as rapid digitalisation overtook their dated business models, with examples like Blockbuster and Kodak easily coming to mind.
Real estate is not immune to technological advances and those that move to adopt new technology quickly enough, often end up being the biggest beneficiaries. Traditionally real estate businesses tend to fall behind when it comes to adopting new trends, however in recent years with the introduction of PropTech, more companies in this sector are exploring what technology could do for them.
From Analogue To Digital
PropTech funding between 2014-2019 has grown by 766%, and it is expected to continue.
The real estate sector is typically regarded as conservative when it comes to technology, but with a plethora of innovative technologies in recent years such as artificial intelligence, it has become hard to not take advantage of the opportunities being presented.
Big Data
90% of all the data we now have in the world was created in the last few years.
With so much accessible information, businesses can easily gain valuable insights into their potential customers. A real estate business might be able to quickly pick up data on buying/selling trends or demographics in a local area etc. to determine the value of their properties.
Data Management
45% of commercial real estate companies are spending 15% to 25% of their time organising and managing data.
With so many assets, keeping on top of data management for a commercial real estate company (CRE) is proving to be difficult. 60% of executives say their firms still use spreadsheets instead of software as their primary tool for reporting.
Digitalisation in commercial real estate
With a combined estimated worth of $50 trillion between real estate and commercial real estate, according to the federal reserve, it is clear to see why technology companies have been keen to showcase the benefits of recent technological advancements, in recent years. Though real estate has been significantly more keen to embrace new technology, CRE hasn’t seen the same level of adoption.
The supply and creation of new, digital tools to manage large property portfolios are coming of age, with viable PropTech solutions on the market that integrate with and enhance their current ways of working. If CREs aren’t already looking to digitalise, now is the time.
Maximising property value
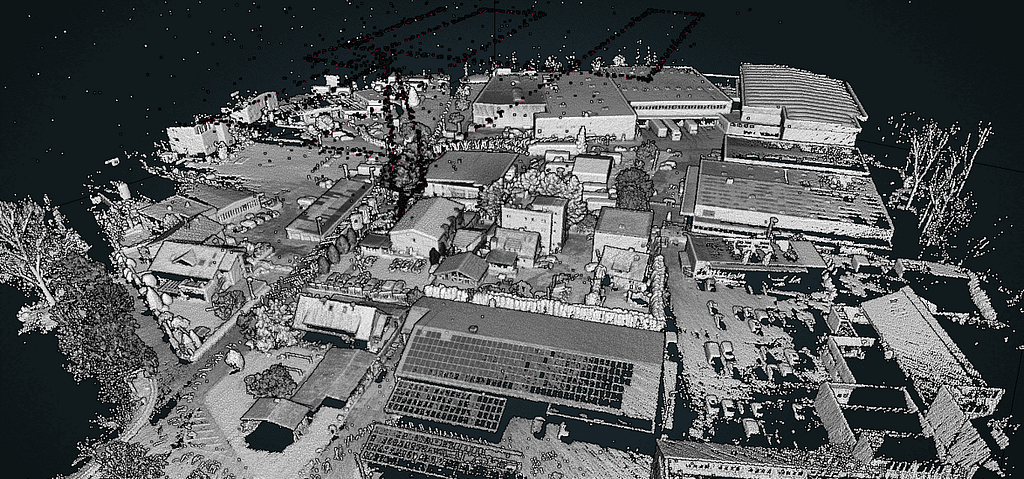
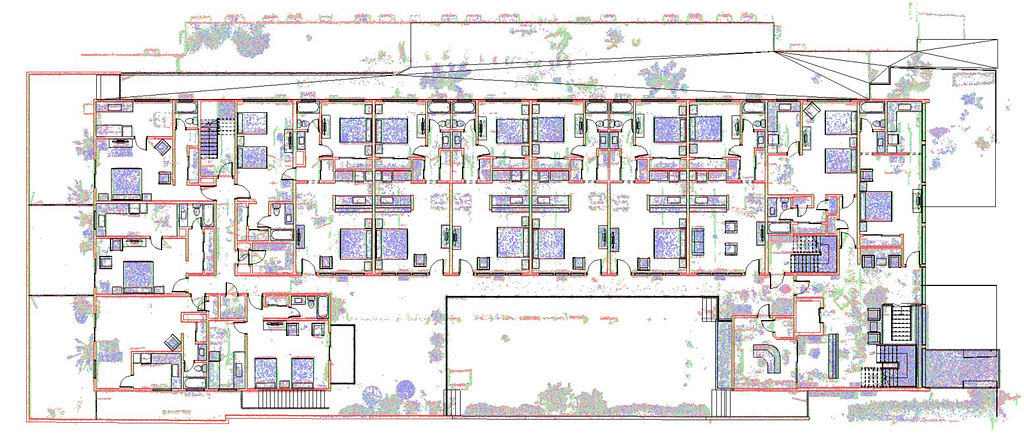
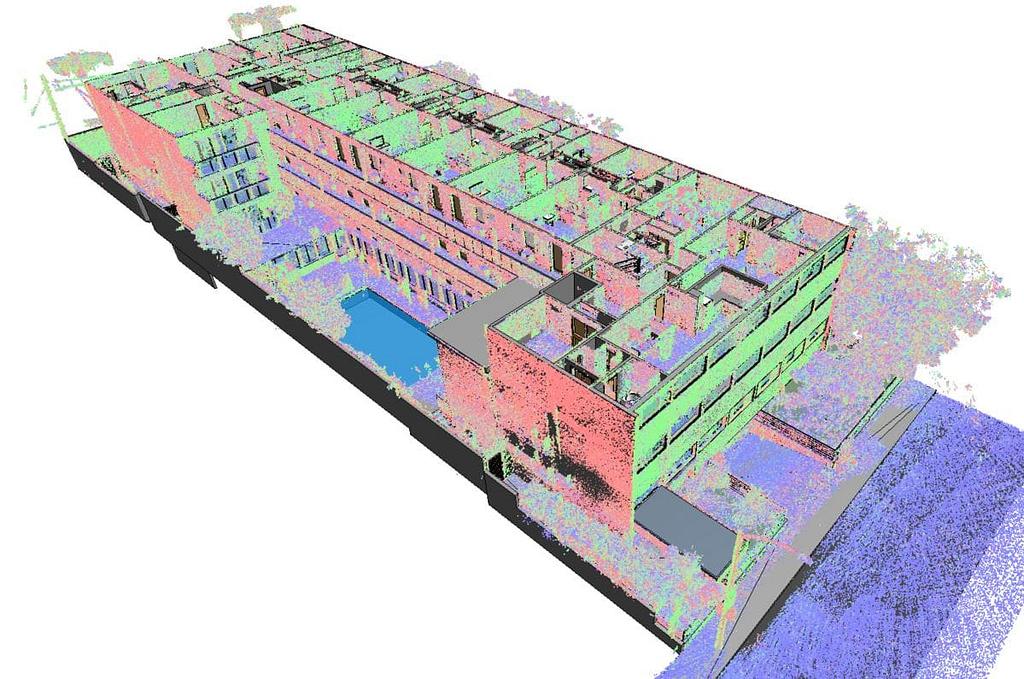
When it comes to maximising the value of property, those in CRE consider many factors, but what is often overlooked is inaccurate measurements of their properties due to human error or underestimating how much the floorplan of a property has changed and adapted over time. In fact, $100 billions are lost globally due to undervalued property. Embracing technological solutions like SLAM laser scanning can give CREs rapid, repeatable and highly accurate measurements and floorplans of their properties, without needing to outsource or rely on dated information.
Digital record keeping
There is a great deal of paperwork involved in CRE management, and not having a digital record is not only inefficient, but it can also be costly. Having all the documents in an easy to access digital library can be helpful when needing to access paperwork quickly. Whether you’re trying to sell your property, or you need to deal with an audit etc. having a centrally stored digital record of your portfolio can help minimise workload and maintain good standards of information keeping.
Repeatable, repeatable, repeatable
“Too many companies are prepared to put up with poor-quality data when it is entirely in their power to improve it” – RICs
With technological solutions now available for repeatedly capturing and keeping data up to date quickly and easily, CRE companies no longer need to rely on old data, ultimately saving them money.
5 ways technology has affected the real estate sector
Early adopters of new technology often pave the way for others to follow in their footsteps, however those that end up following often play catch up.
Building Information Modelling (BIM)
The introduction of 3D digital models has been revolutionary for many sectors, including real estate. This digitised advancement means better planning and execution of real estate projects.
Property Estimates
Technology makes processing and storing complex data incredibly easy, making estimations of property value more accurate.
Virtual Tours
Virtual tours of properties have significantly reduced the distances between a buyer and seller. Somebody in the USA could now purchase a property in the UK without having physically set foot in the building.
Digital Marketing
With the advancements of digital technology comes the shift to online marketing. Traditionally selling real estate was the sole task of real estate agents, however 47% of companies in 2018 acknowledged that their highest quality of marketing leads came from social media.
Internet of Things (IoT)
As technology is intertwined into our everyday life now more than ever, it’s shouldn’t be a shock that people buying property want their homes/buildings interconnected. Real estate buyers know this, and have begun investing and developing technologically optimised buildings for the buyers of tomorrow.
GeoSLAM Floorplans
Over the past few years, we have been working with real estate companies to make it easier to understand buildings. Combining the use of our handheld SLAM scanners and new intuitive software, GeoSLAM Floorplans was born. In a few simple steps, CRE companies can now have accurate measurements of their buildings, in often large building portfolios, and they completely own the data with no monthly costs to store the data. As a result, CRE companies are able to maximise their property value and have easy to read digital records of their assets.
Digital technologies are being embraced in real estate
Though initially slow to react, property and real estate professionals are now embracing technological innovations and shifting the way we have traditionally viewed the sector. With Property technology only being a recent phenomena and technological innovations being developed and improved year on year, this is just the beginning of the changes to come – those that continue to be early adopters of new technology, will ultimately come out on top in the end.
Get in touch
Want to learn more about GeoSLAM Floorplans and how it could transform your business? Submit the form below and we’ll be in touch.
Getting the full value of digital in construction – why it’s so hard.
Innovation in construction gets a bad rap. Which feels somewhat unfair, after all, it is a ‘bricks and mortar’ industry, heavily reliant on equipment, machinery and a ‘hands-on’ workforce. The industry is often flouted as falling behind others in how it has embraced technology. Yet in recent years in particular, many forward-looking construction companies have deployed innovative solutions to better, and more safely, construct buildings.
But few companies have captured the full benefit of digital, and some have questioned whether they have the right approach. Piloting is one-thing, getting company-wide adoption is another. And it’s not hard to see why. As construction projects are typically fragmented, there are a number of hurdles for companies to overcome:
Data, Data Everywhere
Making good decisions relies on insightful data, and construction sites have a lot of it. In fact, the volume is simply staggering. However, it exists in siloed, distributed forms. There isn’t a single source of the truth.
Complex Supply-Chain
The success of a new build relies entirely on the strength of the team, more specifically the flow of data between all parties. With multiple layers of contractors and subcontractors in the project delivery supply-chain and with constant moving parts, tight collaborations is essential. But many firms struggle to operate a common data exchange.
Stuck in Analog
The construction process remains one of the least digitised industries worldwide. Many processes are still manual, error-prone and have a not-so-hidden penalty cost (there’s a 3 in 4 chance the scheduled completion date will delay by 40% or more on mega projects). Disputes, claims, fines – the risks of delays and cost overruns are a reality for many construction firms who have failed to automate.
Digital Isolation
As projects vary greatly, it’s hard to develop tools and methods that can be applied repeatedly. Teams or business units may develop their own subscale solution, without co-ordinating with others. Despite an influx of new technology providers to the sector, many of them offer stand-alone solutions that are not integrated within the wider use of technology in construction companies.
With the global population predicted to hit 9 billion by 2050 – and two out of every three people living in cities by 2050 – the demand for better, faster greener construction has never been greater. In addition, due to the pandemic, there is increased pressure on the construction sector to help ‘level-up’ the economy. Innovation and pace are needed. Could digital technologies, well-chosen and well-deployed, provide the key?
BIM is the right direction, but isn’t the whole answer.
According to the Future of Construction, Building Information Modelling (BIM) is the centre piece of the construction industry’s digital transformation. Over the last decade BIM awareness and adoption has grown from little more than 10% in 2011 to over 70% in 2020. And the benefits speak for themselves: NBS reports that adopters report greater predictability of building performance, price and programme; as well as reduced risk and increased profitability.
Yet while BIM standards are becoming embedded, and thankfully fewer people see BIM simply as ‘3D modelling’, there is still work to narrow the gulf between ‘BIM engaged’ and ‘BIM laggards’. Deploying cutting-edge technology is only one aspect. Having the mindset and approach to collaborate is what will really unlock the value of the tech.
At the core of BIM success is collaboration. In fact, you can’t really ‘do’ BIM if you don’t have the entire team on board in the earliest stages. NBS
Paving the way to success: why you need a holistic approach.
Aside from BIM, there are a number of connected construction technologies that are being adopted to streamline and ease the process of constructing our built world. But given the array of new technologies on offer, where’s the best place to start?
When the pandemic hit in 2020, and ‘working from home’ just became ‘working’, we all realised the difficulties in communicating and collaborating with remote teams. Add to that the challenge construction professionals already had of multi-layered teams, and it’s easy to see where the friction could be.
What makes construction complex is not the complexity of the building, it’s the number of people that are required to work together to make it happen. Nathan Wood, Executive Director, Construction Progress Coalition
While it’s tempting to cherry-pick solutions that fix a particular problem, developing narrow use cases may mean missing out on the wider opportunity. But by taking a collaboration-first approach and starting with technology that improves knowledge-sharing, smooths interactions and boosts interoperability, this could have significant knock-on effects to address other challenges, too.
For example, selecting tech that has the potential to integrate well with all other platforms means you’re not facing digital isolation. And by putting data transparency and data collection first by choosing tools that create 3D maps, this data can in turn, be used as the anchor for better decisions between all parties. And in unlocking collaboration barriers, this could be the key to creating lasting value.
In ‘Decoding Digital Transformation in Construction’ McKinsey & Co., cites how one collaboration tool drove down rework costs for a leading contractor. The quoted example talks about the contractor’s process for collecting comments on defects found onsite. Workers typically provided anecdotal, unstructured or difficult to act on feedback, which resulted in unplanned rework and delays.
This radically turned around when the contractor introduced a digital app to tag defects against specific elements in the BIM model and store them in a common data environment. A simple but effective collaboration solution that on-site teams could easily adopt. It smoothed out communication plus reduced rework and improved the bottom line.
5 ways a collaboration-first approach can transform Construction
Companies that take a collaboration-first approach put themselves in a much stronger competitive position. Not only can they get first-mover advantage, but they can boost productivity at the same time as keeping costs down:
Save Money
Construction has a long record of poor productivity and firms experience delays on a quarter of their projects, with nearly one fifth of projects going over budget. But with the wide adoption of mass data collection technologies, site workers can now carry out a weekly, or even daily, ‘as-built’ scan of a site which highlights any discrepancies or defects during the build. NBS research suggests that 3D modelling technology can deliver cost efficiencies (60%) and increase speed of delivery (55%).
Unify Delivery Teams
With multiple stakeholders engaged at various points of the project lifecycle, having “one source of the truth” such as BIM, enables greater collaboration and more informed decision-making. Data is brought out of silos and there’s a consolidated view of all critical information, that everyone can see, in real-time. This improves workflow, predictability and removes bottlenecks. Critical to this is having a mapping tool that accurately captures the data in 3D model form and provides an anchor for all data extracts.
Automate Construction
AI-powered solutions not only automate but accelerate non-value-add tasks across teams. This helps improve site efficiency and allows site workers to expand their capabilities. For example, on site, AI can provide real-time alerts in the event of safety violations, such as if PPE is not used at all times. And in the back office AI can easily reconcile budgets and billing by matching what happens on the ground to what’s been billed.
Improve Data Integrity
To be able to make better decisions faster, construction professionals need to know they’re confidently working with the most accurate data. A Common Data Exchange, such as the one being trailblazed by the Construction Progress Coalition will not only transform project collaboration but address the common data dilemma of getting the right info to the right people at the right time. It will also improve overall data integrity, data usage and make it easier to evidence compliance.
Perfect the Model Virtually
Being able to create an exact mirror of the asset in a digital twin, means you can spot and correct irregularities before building work starts, as well as monitor and correct defects on-site. This enables clients to mitigate some of the risk, time and cost impacts of complex construction projects. IDC predicts that companies that invest in digital twin technology improve cycle times of critical processes by 30%.
We make it, before we make it
Royal BAM Group has a phrase that has become synonymous with the company which is, ‘We make it before we make it’. This digital-first approach enables the company to easily visualise the construction schedule, flag any potential problems and get back on track – while saving on rework.
This type of approach which aims to manage and share data between all key parties, is especially helpful when regenerating buildings or constructing new builds in busy cities. Aside from operating on constrained sites in busy locations (e.g., where the site footprint is the building footprint), sites are often live environments, with businesses in occupation. Staging construction offsite, or ‘just-in-time’ construction enables all stakeholders to virtually test the stress factors and tolerances of an asset in multiple ways, before the asset is built.
How a leading UK contractor uses collaborative mapping technology to keep complex projects on track with daily scans
Wilmott Dixon is a privately-owned construction and interior fit-out specialist renowned for working on large and complex projects across the UK. To keep projects on-track, the contractor wanted to equip on-site teams with user-friendly mapping technology that could be quickly adopted and used by anyone. Scanners needed to be mobile, lightweight, and fast – and work in any weather. Mapping software needed to be automated, accurate and easy to interpret. GeoSLAM’s Construction Progress solution ticked all the boxes.
This innovative solution combines hardware, advanced SLAM and automated analytics for smart progress tracking. Site workers ‘walk-and-scan’ with a handheld SLAM scanner, and by simply plugging the scanner into a computer, the data is automatically processed using GeoSLAM’s smart data platform, Connect. This is digitally compared against the 3D model on record, and within minutes an automated report will show you the percentage of work complete/incomplete and a simple visualisation of the site, highlighting 3D changes.
The data is centrally stored providing a clear and reliable audit trail and remote teams can confidently share progress updates knowing they have a central source of the truth. Teams can continuously collect data as often as they need to, in some cases several times a day. The automated solution not only saves time and money but enables Wilmott Dixon to be on the front foot and proactively address any issues. It’s just one way the national contractor delivers lasting value.
The key unlocking value in construction
Like many industries, the future of construction is firmly rooted in leveraging the benefits of digital technology to deliver better outcomes. While building sites will always be an organised chaos of physical, tangible assets, there’s still a huge opportunity for technology to transform the way buildings are constructed. But if you’re not getting the full value from digital technology alone, don’t give up. There is a better way. Given the history of fragmentation and siloed working in construction, it follows that any, and every, digital innovation should seek to address this traditional way of working. And in doing so, will not only be a single-use case, but will have ripple effects across the whole value chain. Now really is the time to double down on digital efforts, collaboratively, of course.
References
Reinventing construction through a productivity revolution | McKinsey
McKinsey Global Institute: Reinventing Construction – A Route to Higher Productivity
Top 4 Challenges Facing the Construction Industry – Future of Construction
An Action Plan to Accelerate Building Information Modelling (BIM) Adoption – Future of Construction
NBS’ 10th National BIM Report | NBS (thenbs.com)
Decoding digital transformation in construction | McKinsey
Smart Market Report – Mitigation of Risk in Construction
NBS – National BIM Report 2019
Innovation Enterprise: Guide to Digital Twin Technology
What is LiDAR and how does it work?
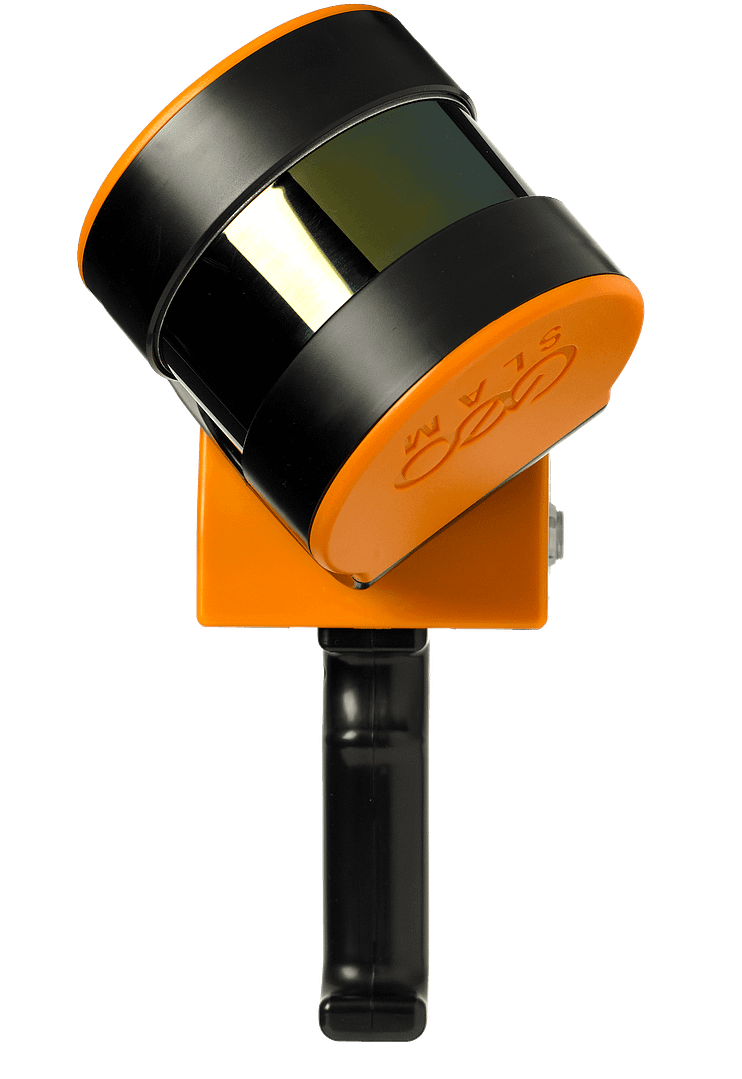
LiDAR sensors are an essential component in GeoSLAM’s mobile mapping solutions. Together with our SLAM algorithm, these two technologies are responsible for producing 3D pictures or “point clouds” of the environment.
LiDAR technology has been around since the 1960’s when laser scanners were mounted to planes. This type of airborne LiDAR emitted light beams towards the surface of the ground to provide distance measurements. LiDAR data became a useful tool for providing accurate geospatial measurements in the late 1980s. The introduction of commercially viable GPS systems made this possible.
What is LiDAR?
LiDAR is a remote sensing method. LiDAR technology uses the light from a laser to collect measurements. These are used to create 3D models and maps of objects and environments.
What does LiDAR stand for?
Light Detection and Ranging. The acronym LiDAR is often used to name this remote sensing method. It uses light to measure distances and is also known as laser scanning or 3D scanning.
How does Light Detection and Ranging (LiDAR) work?
A LiDAR system calculates how long it takes for beams of light to hit an object or surface and reflect back to the laser scanner. The distance is then calculated using the velocity of light*. These are known as ‘Time of Flight’ measurements.
*The velocity, or speed of light is 299,792,458 metres per second
How do LiDAR sensors work?
Depending on the sensor used, LiDAR scanning units can fire hundreds of thousands of pulses per second. These light waves bounce off objects and return to the LiDAR sensor. The sensor uses the time it takes for each pulse to return to calculate distance (time of flight). Each of these pulsed laser measurements, or returns, can be processed into a 3D visualization known as a ‘point cloud’. That’s how a LiDAR sensor works explained in a nutshell.
What is the difference between Radar and LiDAR?
LiDAR works in a similar way to Radar and Sonar yet uses light waves from a laser, instead of radio or sound waves.
What is LiDAR Technology?
LiDAR technology is the application of the remote sensing method described above. It is usually used to examine the surface of the earth, assess information about the ground surface, create a digital twin of an object or detail a range of geospatial information. LiDAR systems harness this technology, using LiDAR data to map three-dimensional models and digital elevation. From handheld to airborne LiDAR, there’s a LiDAR system to capture the data you need. LiDAR mapping uses a laser scanning system with an integrated Inertial Measurement Unit (IMU) and GNSS receiver or in GeoSLAM’s case, the SLAM algorithm, which allows each measurement, or points in the resulting point cloud, to be georeferenced. Each ‘point’ combines to create a 3D representation of the target object or area.
LiDAR maps can be used to give positional accuracy – both absolute and relative, to allow viewers of the data to know where in the world the data was collected and how each point relates to objects terms of distance.
LiDAR data, in the form or a point cloud, can be used to map entire cities, enabling decision makers to accurately pinpoint structures or areas of interest in millimetre perfect detail. Features and objects such as road networks, bridges, street furniture and vegetation can be classified and extracted.
LiDAR maps can also be used to highlight changes and abnormalities such as surface degradation, slope changes and vegetation growth.
What can you use LiDAR systems and data for?
There aren’t many applications that wouldn’t benefit from using LiDAR. From the games industry to Formula 1 teams – simulations based on 3D models are often used to give teams the edge before setting foot on a racetrack.
Mapping: Surveying tasks often require LiDAR systems to collect three-dimensional measurements. They can create digital terrain (DTM) and digital elevation models (DEMs) of specific landscapes.
Architecture: Laser scanning systems are popular for surveying the built environment too. This covers buildings, road networks, and railways.
Real Estate: Laser scanners can be used indoors to measure space and create accurate floorplans.
Construction: The construction industry is also using LiDAR surveys increasingly. LiDAR technology tracks building projects and produces digital twins for BIM applications. It can also help produce 3D models for the conditional monitoring of structures, and revit models for architects and structural engineers.
The Environment: Environmental applications for LiDAR are plentiful. Laser scanning is a popular method of mapping flood risk, carbon stocks in forestry, and monitoring coastal erosion.
Automotive: LiDAR is also seeing increased levels of adoption for automation applications. Smaller, low-range LiDAR scanners help navigate autonomous vehicles.
Space Travel: If that wasn’t enough, LiDAR data isn’t only useful on earth! It has been identified by NASA as key in enabling them to land lunar vehicles safely.
What is LiDAR mapping?
LiDAR mapping uses a laser scanning system with an integrated Inertial Measurement Unit (IMU) and GNSS receiver. In GeoSLAM’s case, we use the SLAM algorithm to power our laser mapping technology. This allows each measurement, or point in the resulting point cloud, to be georeferenced. Each ‘point’ combines to create a 3D representation of the target object or area.
LiDAR maps give absolute and relative positional accuracy. This allows viewers of the data to know where in the world the data was collected and how each point relates to objects in terms of distance.
LiDAR point cloud data can map entire cities. Decision-makers can pinpoint structures or areas of interest in millimetre perfect detail. Features and objects such as road networks, bridges, street furniture, and vegetation can be classified and extracted.
LiDAR maps can also highlight changes and abnormalities such as surface degradation, slope changes and vegetation growth.
What are digital elevation models (DEMs)?
A digital elevation model (DEM) is a three dimensional representation of terrain and all the objects within that space. Regularly spaced elevation values collected from LiDAR scans create a coordinate system that allows the earth to be reflected and modelled with a high level of accuracy.
What are digital terrain models (DTMs)?
Digital terrain models are just like DEMs, without the objects included. They use LiDAR to map the terrain only.
LiDAR Scanning Technology Explained
So, what is LiDAR? Hopefully, we’ve satisfied your curiosity about LiDAR (light detection and ranging). This pulsed laser technology has so many applications for mapping, providing detailed information and data on the environment. What’s more, you can be assured of speed and accuracy when you carry out a LiDAR scan.
If you’re looking for a LiDAR scanner for a business application, GeoSLAM technology gives you the power to collect the geospatial data you need. Our range of handheld laser scanners uses LiDAR and SLAM technology to produce point clouds for many different applications. Contact us for more information, and find out what a new GeoSLAM LiDAR laser scanner could do for you.
What is SLAM (Simultaneous Localisation and Mapping)?
The SLAM revolution
Everything you need to know about the ground-breaking technology.
For anyone interested in mapping the world around them, SLAM has been a complete game-changer. But what exactly is this technology, how does it work and what’s the right SLAM for you?
What is SLAM?
SLAM stands for simultaneous localisation and mapping (sometimes called synchronised localisation and mapping). It is the process of mapping an area whilst keeping track of the location of the device within that area. This is what makes mobile mapping possible. This allows map construction of large areas in much shorter spaces of time as areas can be measured using mobile robots, drones or vehicles. SLAM systems simplify data collection and can be used in outdoor or indoor environments.
Simultaneous Localization And Mapping – it’s essentially complex algorithms that map an unknown environment.
Using SLAM software, a device can simultaneously localise (locate itself in the map) and map (create a virtual map of the location) using SLAM algorithms.
Sensors may use visual data, or non-visible data sources and basic positional data, using an inertial measurement unit (IMU). Using this sensor data, the device computes a ‘best estimate’ of where it is. As new positional information is collected every few seconds, features align, and the estimate improves.
SLAM can trace its early development back to the robotics industry in the 1980s and 1990s.
Today, SLAM technology is used in many industries. It has really opened up opportunities to better map and understand environments whether they are indoor, outdoor, in-air or underground
There are many different types of SLAM algorithms and approaches to SLAM
Graph SLAM
EFK SLAM
Fast SLAM
Topological SLAM
Visual SLAM
2D LiDAR SLAM
3D LiDAR SLAM
ORB SLAM
What is visual SLAM?
Visual SLAM, also known as vSLAM, calculates the position and orientation of a device with respect to its surroundings while mapping the environment at the same time, using only visual inputs from a camera.
Feature-based visual SLAM typically tracks points of interest through successive camera frames to triangulate the 3D position of the camera, this information is then used to build a 3D map.
What is LiDAR SLAM?
A LiDAR-based SLAM system uses a laser sensor to generate a 3D map of its environment. LiDAR (Light Detection and Ranging) measures the distance to an object (for example, a wall or chair leg) by illuminating the object using an active laser “pulse”.
LiDAR is both a fast and accurate approach and can be used in a wide range of environments and conditions.
The laser sensor point cloud generated from this method is highly accurate and is ideal for mapping in construction. These high precision distance measurements can be used for a whole host of other applications too.
How mapping has changed.
For anyone involved in the acquisition of geospatial data, SLAM is a huge game-changer. Gone are the days of multiple, static set-ups of bulky, tripod-based systems.
Go-anywhere mapping – rapidly and simply walk through an environment, building a digital map as you go.
SLAM can even be used to map unknown environments, helping us to learn more about the world around us.
SLAM in action
What’s the right SLAM for you?
If you’re wanting to create a highly accurate 3D map of an underground mine, inside a building or from a UAV, you’d get the best results with a LiDAR SLAM. But if you’re wanting SLAM for computer vision (AR) or unmanned robots, then Visual SLAM could be selected.
Here are six areas to consider:
Speed and accuracy
Quality and distortion
Flexibility and deployment
Real-time data capture
Usage in multi-environments
Coupling with hardware
Not all SLAMs are created equal.
The CT (Continuous Time) SLAM technology used inside GeoSLAM’s product portfolio was developed by some of the smartest people on the planet. We’ve taken our technology into notoriously difficult scanning environments, such as repetitive corridors, smooth-sided tunnels and spaces with moving people, where it’s been refined, honed and pushed to breaking point. The result is a constantly improving SLAM algorithm, one that is so robust that it now works equally well in outdoor open environments as it does indoors.
A brief history of the SLAM in GeoSLAM
In 2008, the CSIRO (Commonwealth Scientific and Industrial Research Organisation) developed a powerful and robust SLAM algorithm primarily focused on accurate 3D measurement and mapping of the environment, rather than autonomous navigation. You may not be familiar with CSIRO, but you’ll certainly be familiar with their work – they invented Wi-Fi, 30-day contact lenses, plastic banknotes, the list goes on. They’re also Australia’s national science agency, pure experts in their field.
In 2012, Data61, the digital innovation arm of CSIRO teamed up with UK geospatial market-leaders 3D Laser Mapping (GeoSLAM’s former sister company) to commercialise their new SLAM. The result was GeoSLAM and this award-winning technology is at the core of all our products.
The first versions of SLAM used images to help with orientation, but for laser scanning a more frequent calculation of position is required and continuous-time SLAM overcomes this limitation. With our sweep-matching GeoSLAM Beam, scan lines are projected in all directions, enabling us to deliver a highly accurate and reliable digital map.
We’ve sold thousands of handheld SLAM systems to businesses’ ever since.
What is GeoSLAM Beam?
GeoSLAM Beam is what we call our next generation SLAM algorithm that powers our software platform, GeoSLAM Connect.
What makes GeoSLAM Beam the best SLAM?
The SLAM technology used inside GeoSLAM products is developed and continually enhanced by some of the smartest people on the planet. With GeoSLAM Beam and Connect you can expect:
Optimised SLAM processing to suit your capture environment
Robust and reliable in different environments, GeoSLAM Beam performs well walking, on robots, cars, scooters, bikes and even boats
Tools and filters for creating clean and accurate point clouds, automatically
Georeferencing your datais easy
A high level of accuracy that meets mapping requirements and exceeds other SLAM based mapping systems using the Velodyne VLP-16 sensor.Take a look at theAccuracy Reportto learn more.
Don’t just take it from us, our customers are continually testing GeoSLAM Beam against competitor SLAM and tell us that our accuracy and reliability are the best in the market.
What are the benefits of using SLAM?
SLAM based systems are inherently mobile – they are at their best when used on the move. Gone are the days of multiple static set-ups of bulky tripod-based systems. With a SLAM mobile mapping system, it’s possible to simply walk through an environment building a digital map as you go, saving time and money by removing laborious set-ups from the equation. SLAM based mobile mapping systems slash survey times and can be over 10 times faster at acquiring data.
Additionally, GPS doesn’t work indoors; it requires a line of sight to at least three satellites to function, but it isn’t just indoors that is out of bounds to GPS based systems. Forests prove difficult, as tree canopies block the line of sight to the sky and urban canyons or tall buildings block signals in built up environments too. SLAM based technology overcomes these obstacles by cutting out GPS altogether. GeoSLAM enables you to reach complex and enclosed spaces, either scanning by hand or by attaching a scanner to a trolley, drone or pole. This opens a whole new realm of environments to be surveyed, that were previously highly problematic, time consuming, or both.
For the built environment, this opens large opportunities as we help construction professionals carry out fast and accurate 3D models in the minimum amount of time, helping them with:
Fast, weekly progress monitoring of construction sites
Real-time surveys of residential, commercial and industrial facilities
Comprehensive site surveys of existing structures to be refurbished, remodelled or extended.
It’s easy to see how SLAM mapping devices are considered a ‘disruptive technology’ in the survey industry.
It’s not just the built environment that benefit – the pre-cursor to the ZEB-1 found its birth in a complex cave system, in south-east Australia. From these humble beginnings, GeoSLAM products have been utilised in caves, mines, forests and open fields, globally. We have customers from all sectors, many of them global enterprise organisations. To cement our market position, we are proud to have built an international dealer network of almost 90 channel partners, in over 50 countries, across all six continents. That’s why we are the experts in go-anywhere 3D mobile mapping technology.
What’s next for GeoSLAM?
Our experienced mathematicians and SLAM developers are constantly working on the next generation of features to offer even more functionality with each release, and we’re going one step further than this with our in-house innovation team headed by GeoSLAM Founder & CEO Graham Hunter.
The initiative behind the foundation of the team is to cement innovation at the heart of all that GeoSLAM does, allowing us to expand our R&D capabilities, to keep delivering industry-leading products and to fortify our place at the cutting edge of global SLAM development.
Tell me more
Get in touch via the form below, and follow GeoSLAM on social for further updates.
Contact us to find out more
Blogs
Keep up to date with the latest news and thought leadership from GeoSLAM.
Bloom Cloud Engine is a powerful on-premise point cloud editor ideal for use in Design, Fabrication, and Construction applications. Easy to deploy across your project team, BloomCE allows users to optimize and condition the point cloud data from all reality capture modalities, providing the fundamentals for Asset Management and Digital Twin project requirements.
Blacklight, based in Romania, focuses on information technology that captures, measures and visualises data used in various fields of activity through providing valuable solutions.
Cybernetech Corporation, based in Japan, is a specialised trading company that offer advanced information and communication equipment and geospatial information technology.
Seiler Instrument is an American company that specialises in distributing surveying software and instruments serving industries such as surveying, engineering and construction.
Favre, Développement & Foresterie, based in Switzerland, are experts in geomatics and work with public and private landowners for forest management and environmental heritage.
3DT Digital Manufacturing is an Australian company that use the latest technology to adapt to changes in real time. It aims to help their customers become more efficient and productive.
Sigma Mascot, based in Hong Kong, provides solutions for 3D Laser Scanning, Geospatial systems and BIM services for industries such as Forestry, Construction and Real Estate.
Precision Laser & Instrument is an American company that offers comprehensive positioning solutions for the Construction, Survey, and GIS industries. They ensure high returns on investments and business success.
Export your point cloud into a range of formats, including LAZ, LAS, PLY and TXT. Datasets can also be exported as structured or unstructured E57 files, both of which include embedded panoramic images.
Surface normals at each point can now be computed from PLY and E57 formats, allowing users to export colourised data and create a high-quality polygonal mesh in third party software .
Stop and Go Georeferencing
Known control points are captured during a scan and automatically compared and matched to the associated coordinates during the processing stage in Connect. A rigid and/or a non-rigid adjustment can be made to the dataset and an accuracy report is exported, highlighting how successful the transformation was. Users can now view and manipulate the processing parameters to ensure a more accurate match between points.
Manual Alignment
Align multiple scans using a combination of manual and automatic processes. This workflow can be performed on two or more scans in the same project. Users have a choice to export the aligned scans separately or as a single merged point cloud.
JP Interactive Viewer
Leverage your GeoSLAM data by integrating JP Interactive Viewer into your workflows. JPIV allows you to unlock the full potential of your reality capture data and distribute actionable insights across your teams.
Our support team will be available for GeoSLAM Care customers on:
Monday 26th, 8 am – 4 pm (GMT)
Tuesday 27th, 8 am – 4 pm (GMT)
Wednesday 28th – 31st December – standard support hours
Monday 2nd January, 8 am – 4 pm (GMT)
From Tuesday 3rd January – standard support hours resume
Test pop-up
fsikajntgfitdshagklndsakj;gnjkdasklngklsa
Click here to view the release notes.
Autodesk Recap
Autodesk Recap contains tools for the manipulation and interpretation of high quality point cloud data and to aid designers and engineers in their creation of 3D models for real-world projects and assets (e.g. buildings and other infrastructure). It’s integrated design features help to streamline workflows, for example Scan to BIM. Recap is used to create initial design projects that users can then take into other Autodesk modules (e.g. Revit, Navisworks, AutoCAD).
Autodesk Navisworks
Autodesk Navisworks is a comprehensive project review solution that supports co-ordination, analysis and communication of design intent and constructability. The software can be used as a common data environment (CDM) for multidisciplinary design data created in a broad range of Building Information Modelling (BIM) packages. Using the tools within Navisworks, users can anticipate and minimise and potential problems between the physical building and the structural model.
Autodesk Revit
Autodesk Revit is a building information modelling (BIM) software. It contains tools which allows for planning and tracking throughout the building’s lifecycle. The software also allows multiple disciplines to collaborate more efficiently and make more informed decisions early in the design process. As GeoSLAM’s hardware allows for quick data capture, the equipment can be used to scan any existing buildings with the purpose of using the data to produce a digital twin.
Orbit GT allows users to capture and manage available 3D data (LiDAR data and imagery), extract a range of features for map production and make data sharable. All Orbit modules are ready to be used with 3D data from indoor, oblique, UAS and mobile mapping projects with other extensions that can be added to the Publisher and Orbit Cloud. Orbit can be used with the ZEB Discovery solution.
ContextCapture
ContextCapture is a reality modelling tool, allowing for the import of any point cloud and imagery data for the creation of high resolution reality meshes. These realistic meshes are accurate representation in 3D with high resolution RGB values of any scanned environment. By using GeoSLAM data in ContextCapture the users are able to create indoor reality meshes, which has been never possible before.
Microstation
Microstation is a 2D/3D software for designing building and infrastructure projects. It includes building information modelling (BIM) tools to document and assess any type of asset throughout its lifecycle. GeoSLAM solutions are often used in Microstation in the underground mining sector and to assess the current stage of any built environment, update the design model, and generate BIM information.
Deswik
With the GeoSLAM Connect stop-and-go georeferencing feature, users can easily georeference headings from known positions and map for analysis of overbreak, underbreak, undercutting and blast roughness calculations. This information is used within Deswik Mapping to analyse headings and levels.
Esri
Outputs from GeoSLAM’s solutions can be input to Esri’s GIS programs and apps, including ArcPro, ArcDesktop, ArcGIS Online and ArcScene. Join point clouds with local geodata or classify and edit scans based on their geography and statistics.
Micromine is a detailed and diverse mining software that provides solutions including modelling, estimation, design, optimisation and scheduling. Once data is exported from Connect it can be imported into Micromine and easily converted into wireframes. These can be used in Micromine for further studies into volumetric slicing, over and underbreak analysis, geologic modelling, face mapping and many more.
Terrasolid provides tools for data processing of airborne and mobile mapping LiDAR data and imagery. It includes different modules for tasks like data manipulation, calibration, georeferencing, point cloud classification, modelling and many more. It is a very powerful tool for a variety of industries, surveyors, civil engineers, planners, designers. Full, UAV or lite versions of Terrasolid modules are available for both MicroStation or Spatix software. All GeoSLAM products are compatible with Terrasolid and GeoSLAM data can be enhanced and edited with this software.
Floorplanner
Floorplanner allows you to draw accurate 2D floorplans within minutes and decorate with over 150,000 items from kitchen appliances to tables and chairs. Data is exported from GeoSLAM Connect in PNG file format with a scale of 1cm per 1 pixel and can be taken into Floorplanner.
Unity
GeoSLAM 3D point cloud data can be imported into Unity 3D Game Engine to generate interactive 3D scenes, where users can create 3D BIM models with textures and explore the space in 3D photorealistic environments.
Unreal Engine
Although Unreal Engine is mainly built for developing games, increasingly users are starting to use it to develop VR applications for understanding the current conditions of buildings, infrastructure and similar. Unreal Engine with a point cloud plugin can be used to visualise GeoSLAM point clouds in VR, which allows for collaboration, simulation and the understanding of current conditions of any scanned environment. Additionally, Unreal Engine tools are completely free.
Veesus Arena4D
Arena4D is a software package for marking up, annotating and editing 3D point cloud data containing a various export capabilities. It has a powerful and simple to use animation package which allows users to visualise massive point clouds in a simple way. GeoSLAM data can be simply uploaded and used in this package for the assessment of the current conditions of any structure, comparing differences between captured data (as built) to designed model (as designed).
Pointfuse
Pointfuse generates 3D meshes from point cloud data and classifies them to building ceilings, walls, windows and other features in IFC format. By using GeoSLAM data with Pointfuse users can very quickly create a classified BIM model with minimal manual input or expertise needed.
MineRP
MineRP has a Spatial DB that uses GeoSLAM data to represent visually the real environment of the underground mine. The software uses other data layers to overlay information on the digital landscape for decision making and tracking.
Pointerra
Pointerra provides a powerful cloud based solution for managing, visualising, working in, analysing, using and sharing massive 3D point clouds and datasets. Pointerra allows users to simply visualise and interrogate GeoSLAM data from anywhere.
Nubigon
Nubigon is a software solution that allows users to seamlessly interact with large point clouds and create visualisations and animations. Take your GeoSLAM point cloud data into Nubigon to create eye-catching flythrough videos.
Here is an example of a visualisation created in Nubigon using GeoSLAM point cloud data:
SLAM Environmental Pre-sets
Common data capture scenarios, such as UAV, outdoor, indoor, linear, and vehicle, have been characterised in Connect and data processing pre-sets for each environment have been defined. These can be selected at the beginning of the data processing stage allowing this process to be highly simplified.
Closed and Open Loop Georeferencing
Both methods match the scan data from a ZEB Locate system with the GPS data collected from the antenna to georeference the point cloud. When a scan starts and ends in the same place, this is classed as “closed loop”. “Open loop” is when the start and end position of a scan are in different locations. Standard SLAM practices apply to both methods of data collection.
Open Loop SLAM for the ZEB Locate is available on request – let’s talk about it.
Stop and Go Alignment
Common static points are captured during several scans meaning that these datasets can be automatically aligned. A single point cloud is then exported as if the data was captured in a single scan.
Floor Slices
Horizontal and vertical slices can be taken from any location within the point cloud. Horizontal floor slices can also be automatically taken at a given height above the floor as defined in the processing stage.
Change Detection
Mostly used in the construction industry, multiple point clouds can be compared and any areas that have changed are automatically highlighted. Point clouds can also be compared with CAD models – for instance to track progress on a construction site – and PDF reports can be generated to present this information.
Queued Processing
Import multiple .geoslam files into Connect for processing and the scans will be processed in the order they were imported. The size of the queue can be defined by the user.
Enquire about the ZEB Horizon RT
Error: Contact form not found.
If your internet connection allows, move the Point Budget slider to the maximum amount available to view all the points in the cloud.
Making the point size smaller using the Point Size slider makes the data easier to view and interpret.
In the tools section of the viewer, you can measure the distance and angles of features within the pointcloud.
Using the materials section of the viewer, you can use the Select Attributes dropdown to view by intensity, elevation and RGB (if pointcloud is coloured)
UK payment plan
UK payment plan info
USA Payment Plan
Coupling with hardware
Some SLAM software algorithms have been made available as open-source on the internet, but they are purely algorithms and not a product that you can take and use off-the-shelf. SLAM is most successful when it is tightly coupled and designed with specific hardware in mind. A generic SLAM cannot perform as well as one that has been specifically designed for a purpose.
Usage in multi-environments
Visual SLAM is closer to the way humans navigate the world, which is why it’s popular with robotic navigation. But in the same vein, vSLAM will have the same image-capture challenges as humans do, for example not being able to look into direct sunlight, or not having enough contrast between the objects picked up in the image. These can be overcome indoors, however, you may need to map a forest, tunnel or urban canyon. While SLAM technologies don’t rely on remote data (meaning you can scan areas where there is no GPS), you do need to ensure the SLAM technology you chose operate well inside, outside, in daylight and darkness.
Real-time data capture
Mapping a property is time-critical. Ideally, you want to make a single visit and gather sufficient data to create a highly accurate 3D model. Ensure the software you choose transforms 3D point cloud data into actionable information in real-time. This allows you to view and interrogate your data whilst still in the field, and make any adjustments, or collect missed data, then and there.
Flexibility and deployment
If you’re trying to map an enclosed environment (e.g. tunnel, mine) or a complex, difficult-to-access space such as a heritage building with tight stairwells and uneven floors, you need to use fully-mobile, adaptable technology. Wheel-based systems, often used with the vSLAM camera, will struggle with access. Handheld devices or LiDAR scanners that can be attached to a drone or pole and still deliver accurate results in a rugged environment are best for navigating hazardous spaces.
Speed and accuracy
While vSLAM is able to provide a qualitative high-level map and sense of the surrounding features, if you’re needing survey-quality accuracy and rich-feature tracking at a local level, you’ll need to consider LiDAR. Cameras require a high-frame-rate and high processing to reconcile data sources and a potential error in visual SLAM is reprojection error, which is the difference between the perceived location of each setpoint
and the actual setpoint.
Quality and distortion
In order to deliver the depth required for high-quality data, a number of depth-sensing cameras are needed with a strong field of view. In most cases, this isn’t possible, especially as cameras with high processing capabilities typically require larger batteries which weigh down airborne scanners, or limit the time of flight. LiDAR is both faster and more accurate than vSLAM, and can deliver detailed point clouds without expensive (and timely) camera processing.